
- Possible Silver U-Turn Report, 7 Feb, 2016
Wow, did the dollar move down this week! It dropped more than it has in quite a while. It fell 1.3mg gold, or 0.1g silver.
Gold and silver bugs of course are excited, as they look at it as the prices of the metals going up $55 and 72 cents respectively. The collapse of what most think of as money—including especially said gold and silver bugs—is great fun and profitable. At least if you’re short the dollar.
By the way, when we say the dollar fell we do not mean in terms of its derivatives such as euro, pound, yuan, and so on. We’re well aware that the dollar index fell from 99.6 to 97. The euro and other currencies are no more suitable for measuring the dollar, than, well the dollar is to measuring gold. And for the same reason. You can’t measure the something by reference to things derived from it.
Last week, we said:
“It’s far too early to call a bottom in the silver price. However, the movement on Thu and Fri is the sort of action we should expect to see more of if silver is to return to a bull market. It will take more action like this before we change our position on the white metal, but it is worth reporting on what we see when we see it.”
Read on for an update on the gold and perhaps more interestingly the silver supply and demand fundamentals…
But first, here’s the graph of the metals’ prices.
The Prices of Gold and Silver

We are interested in the changing equilibrium created when some market participants are accumulating hoards and others are dishoarding. Of course, what makes it exciting is that speculators can (temporarily) exaggerate or fight against the trend. The speculators are often acting on rumors, technical analysis, or partial data about flows into or out of one corner of the market. That kind of information can’t tell them whether the globe, on net, is hoarding or dishoarding.
One could point out that gold does not, on net, go into or out of anything. Yes, that is true. But it can come out of hoards and into carry trades. That is what we study. The gold basis tells us about this dynamic.
Conventional techniques for analyzing supply and demand are inapplicable to gold and silver, because the monetary metals have such high inventories. In normal commodities, inventories divided by annual production (stocks to flows) can be measured in months. The world just does not keep much inventory in wheat or oil.
With gold and silver, stocks to flows is measured in decades. Every ounce of those massive stockpiles is potential supply. Everyone on the planet is potential demand. At the right price, and under the right conditions. Looking at incremental changes in mine output or electronic manufacturing is not helpful to predict the future prices of the metals. For an introduction and guide to our concepts and theory, click here.
Next, this is a graph of the gold price measured in silver, otherwise known as the gold to silver ratio. The ratio was volatile this week, first up and then down, but it ended down but a smidge.
The Ratio of the Gold Price to the Silver Price

For each metal, we will look at a graph of the basis and cobasis overlaid with the price of the dollar in terms of the respective metal. It will make it easier to provide brief commentary. The dollar will be represented in green, the basis in blue and cobasis in red.
Here is the gold graph.
The Gold Basis and Cobasis and the Dollar Price

The red cobasis line (i.e. scarcity) is overall tracking the price of the dollar in gold (i.e. the inverse of the gold price). In other words, as the price of gold rises, the metal becomes less scarce. However, notice that move up on Friday. The cobasis did not close much below last Friday’s level, despite the price of gold moving up sharply.
The fundamental price of gold moved up this week, though not as much as the market price. The fundamental remains a hundred bucks above market. Gold is still offered on discount.
Now let’s look at silver.
The Silver Basis and Cobasis and the Dollar Price

Whoa. Unfortunately for silver speculators, the cobasis fell dramatically. Silver is simply more abundant to the market at this higher price.
To our comment last week, one can either take hope or despair. The hopeful part is that the fundamental price did move up about 30 cents. That makes two weeks in a row for strengthening fundamentals.
The not-so-hopeful bit is that the fundamentals did not move nearly so much as the market. Less than half as much, in fact.
This action could be consistent with a durable turn in the market. It could also be consistent with the same old pattern we’ve had for a long time: volatility in the basis along with volatility in the price.
What gives us pause (aside from the magnitude of the drop in silver price, both in terms of calendar time as well as dollars) is that there seems to be such pervasive expectations in the precious metals community. If the horse is to remain firmly in front of the horse, it is the hoarders that have to come in with sizeable and lasting demand first. Then, and only then, will the speculators have their long-awaited opportunity to front-them amidst a market price than only wants to go up.
What gives us reason for hope of rising prices is that surely defaults are coming. Crude oil may be up from $26 to $31, but we doubt that is going to save many commodity producers. Meanwhile, the price of transporting bulk dry goods has collapsed to a fresh new low that’s about half of the post-2009 low (and a small fraction of the level before the crisis hit in 2008). How are shipping companies going to service their debts? And what about the other commodity producers who used to hire these ships to send their goods? What about smelters, refiners, sheet manufacturers, and for that matter automakers and construction firms? More layoffs are coming, which will mean repossessed cars, foreclosed homes, evicted tenants, and all of the other wreckage familiar from 2008.
The rising dollar itself is a threat to many borrowers worldwide, as they have income in their national currencies which are falling (notwithstanding the action this week) against the dollar. In other words, their monthly payments are going up.
Gold, and to a lesser extent silver, are the only financial assets that provide a haven in a debt default storm.
We shall see. The markets are offering more excitement than they have in quite a while. Look tomorrow for our analysis of the silver fix fiasco that occurred last week.
© 2016 Monetary Metals

- Why The 'Sultan Of Chaos' Is Freaking Out
Authored by Pepe Escobar, originally posted Op-Ed at RT.com,
Picture sleepless nights at ‘Sultan’ Erdogan’s palace in Ankara. Imagine him livid when he learns the Syrian Arab Army (SAA), backed by Russian air power, started a preemptive Battle of Aleppo – through the Bayirbucak region – cutting off Ankara’s top weaponizing corridor and Jihadi highway. Residents inspect damage after airstrikes by pro-Syrian government forces in Anadan city, about 10 kilometers away from the towns of Nubul and Zahraa, Northern Aleppo countryside, Syria February 3, 2016. © Abdalrhman Ismail / ReutersWho controls this corridor will control the final outcome of the war in Syria.Meanwhile, in Geneva, the remote-controlled Syrian opposition, a.k.a. High Negotiations Committee, graphically demonstrated they never wanted to meet with the Damascus delegation in the first place – “proximity” talks or otherwise, even after Washington and Moscow roughly agreed on a two-year transition plan leading to a theoretically secular, nonsectarian Syria.The Saudi front wanted no less than Ahrar al-Sham, Jaysh al-Islam and all Jabhat al-Nusra, a.k.a. al-Qaeda in Syria, collaborators at the table in Geneva. So the Geneva charade, quicker than one can say “Road to Aleppo!” was exposed for what it is.
And forget about NATO
Notorious Saudi intel mastermind Prince Turki, a former mentor of one Osama bin Laden, has been to Paris on a PR offensive; all he could muster was an avalanche of non-denial denials – and blaming the whole Syria tragedy on Bashar al-Assad.
The bulk of the Syrian ‘opposition’ used to be armchair warriors co-opted by the CIA for years, as well as CIA Muslim Brotherhood patsies/vassals. Many of these characters preferred the joys of Paris to a hard slog on Syrian ground. Now the ‘opposition’ is basically warlords answering to the House of Saud even for bottles of water – regardless of the suit-and-tie former Ba’ath Party ministers handpicked to be the face of the opposition for the gullible Western corporate media.
Meanwhile, the ‘4+1’ – Russia, Syria, Iran, Iraq, plus Hezbollah – is now winning decisive facts on the ground. The break down; there won’t be regime change in Damascus. Yet no one broke the news to the Turks and Saudis.
‘Sultan’ Erdogan is wallowing in a sea of desperation. He continues to divert the gravely serious issues at stake to his own war against the PYD – the umbrella organization of the Syrian Kurds – and the YPG (People's Protection Units, their military wing). Erdogan and Prime Minister Davutoglu wanted the PYD not only banned from Geneva but they want it smashed on the ground, as they see the PYD/YPG as “terrorists” allied to the PKK.

Yet what is ‘Sultan’ Erdogan going to do? Defy the recently arrived 4G++ Sukhoi Su-35S fighters – which are scaring the hell out of every NATO Dr. Strangelove? The Turkish Air Force putting its bases on “orange alert” may scare the odd vagrant dog at best. The same applies to NATO Secretary-General, figurehead Jens Stoltenberg, pleading to Russia “to act responsibly and fully respect NATO airspace.”
Moscow is going after the Turkmen with a vengeance and at the same time providing air support to the PYD west of the Euphrates. That hits the ‘Sultan’ in his heart of hearts; after all Erdogan has threatened multiple times that a PYD/YPG advance west of the Euphrates is the ultimate red line.
An already scared NATO won’t support the folly of an Erdogan war against Russia – as much as US and UK neocons may crave it; as NATO decisions must be unanimous, the last thing EU powers Germany and France want is yet another Southwest Asia war. NATO may deploy the odd Patriot missiles in southern Anatolia and the odd AWACs to support the Turkish Air Force. But that’s it.
Pick your favorite regime change
ISIS/ISIL/Daesh, meanwhile, continues to profit from its own Jihadi highway across a 98 kilometer stretch of Turkish/Syrian border, especially in Jarablus and Al Rai across from Gaziantep and Kilis in Turkey.
Taking a cue from Israel, Ankara is building a wall – 3.6 meters high, 2.5 meters wide – covering the stretch between Elbeyli and Kilis, essentially for propaganda purposes. Because the Jihadi Highway, for all practical purposes, remains open – even as Turkish Armed Forces may apprehend the odd trespasser (always released). We're talking about a monster smuggler/soldier scam; as much as $300 change hands for each night crossing and a noncommissioned Turkish officer may earn as much as $2,500 to look the other way for a few minutes.
The real question is why Gaziantep is not under a curfew imposed from Ankara, with thousands of Turkish Special Forces actually fighting a “war on terra” on the spot. That’s because Ankara and provincial authorities couldn’t give a damn; the real priority is Erdogan’s war on the Kurds.
This brings us to the only leverage the ‘Sultan’ may enjoy at the moment. From Brussels to Berlin, sound minds are terrified that the EU is now actually hostage to Erdogan’s Kurd “priority”, while Ankara is doing next to nothing to fight massive migrant smuggling.
When Davutoglu went to Berlin recently not only did he make no promises; he re-stressed Erdogan’s vow to "annihilate" the Syrian Kurds.
And that explains German Chancellor Angela Merkel’s own desperation. How could the alleged most powerful politician in Europe falls for such a crude extortion racket? The ‘Sultan’ wants a lot of cash, a lot of concessions, and even a further shot at entering the EU. Otherwise, he won’t turn off the tap on the grim refugee flood.
No wonder the regime change rumor mill is frantic. In Ankara? No; in Berlin.

- 10-Year Old Austrian Boy Raped By Iraqi Refugee Due To "Sexual Emergency"
Someone didn’t read the refugee pool rules cartoon.
As you might have heard, quite a few of the millions of asylum seekers that have inundated Western Europe are having a rather difficult time adjusting. Specifically, there seems to be some confusion about pool etiquette.
Last month, Bornheim – a town of 48,000 some 30 km south of Cologne, Germany – banned adult male asylum seekers from the public swimming pool after numerous reports of sexual harassment and “chatting up” – whatever that means.
“There have been complaints of sexual harassment and chatting-up going on in this swimming pool … by groups of young men, and this has prompted some women to leave (the premises),” deputy mayor Markus Schnapka told Reuters. “This led to my decision that adult males from our asylum shelters may not enter the swimming pool until further notice.”
Bornheim’s decree came two weeks after “gangs” of “Arabs” allegedly assaulted scores of women amid New Year’s Eve festivities in Cologne and other cities across Europe.
This weekend, we learn that on December 2, a 20-year-old Iraqi migrant apparently raped a 10-year-old boy at the Resienbad pool in Vienna.

The attack wasn’t reported to the press at the time in order to protect the victim who ran crying to a lifeguard after the assault which took place in a “cubicle.”
The refugee – who at that point had gone back to swimming and diving – was arrested on the spot and taken into custody where he told police that he was experiencing a “sexual emergency.”
“I followed my desires,” the man said, adding that he “hadn’t had sex in four months.” He went on to say that although he was fully aware that his actions were “forbidden in any country in the world,” he had “a marked surplus of sexual energy.”
The man said he had a wife and a daughter in Iraq.
Asked if information about the attack was deliberately withheld from the public in order to avoid sparking a backlash against asylum seekers, Thomas Keiblinger, spokesman for the state police in Vienna said that the fact the man was Iraqi had nothing to do with the decision not to publicize the crime. “It played no role whatsoever,” he told Kronen Zeitung.
Needless to say, that seems like a dubious proposition. The anti-migrant sentiment is palpable in Austria (the country has suspended Schengen) and Iraqis raping 10-year-old boys at swimming pools likely wouldn’t reflect all that well on officials who have agreed to take in asylum seekers.
In any event, we’re reasonably sure that the perpetrator’s “sexual emergency” excuse isn’t going to fly with the Austrian public, so you can expect this rather unfortunate event to add fuel to a fire that, as evidenced by Saturday’s bloc-wide PEGIDA rallies, is already burning brightly.


- Catch Up On The Latest Chinese News With These Seven Bullets
With China offline for the next seven days as its celebrates its Lunar New Year, here are 7 bullets from Evercore ISI to get everyone up to speed on the latest developments in the world’s most troubled “growth” economy.
Evercore ISI China Weekly Summary
No one can remember (and we can’t think up) more than 7 bullets on anything. Here, this week’s top China 7.
- Lunar New Year, Feb 7 – 13. All markets, business and gov’t closed the entire week. There will be little news. All on vacation; many headed home. Jan-Feb data are always fouled up.
- Beijing says 6.5 – 7.0% is the 2016 Real GDP growth target. In China — targets ‘set’ are targets ‘met.’ But actual economic growth this rapid — implausible to us.
- We have seen a giant rise recently in cheerleading stories in China’s media by many officials – claiming all is OK in the economy, finance and currency. This is jawboning up confidence. Not convincing to anyone.
- China’s domestic equity markets remain broken. Friday close 2763 — down 21.9% YTD; down 46.5% since Jun 2015 peak of (5166). The State is in charge; not investors.
- The Chinese citizenry can’t find enough attractive destinations for their savings. So, creative new instruments are arriving just in time to fill the vacuum in an environment of — doubtful regulation, unsophisticated investors, a weak economy and a leadership elite with little ‘appreciation of’ or ‘experience with’ market forces.
- CNY is still on a downward path, albeit with interruptions. We are using 6.80/USD year-end 2016; now 6.53/USD. Forex Reserves Jan, down $99 bln, vs. Dec, down $108 bln. We are not alarmed.
- New housing stimulus this last week. A five percentage point reduction in minimum down-payment for both first home and second home buyers. Small help.

- Steve Keen Exposes Our Dysfunctional Monetary System
Authored by Steve Keen, originally posted at Forbes.com,
The great tragedy of the global economic malaise is that it is caused by a shortage of something that is essentially costless to produce: money.
Both banks and governments can produce money at physically trivial costs. Banks create money by creating a loan, and the establishment costs of a loan are miniscule compared to the value of the money created by it—of the order of $3 for every $100 created.
Governments create money by running a deficit—by spending more on the public than they get back from the public in taxes. As inefficient as government might be, that process too costs a tiny amount, compared to the amount of money generated by the deficit itself.
But despite how easy the money creation process is, in the aftermath to the 2008 crisis, both banks and governments are doing a lousy job of producing the money the public needs, for two very different reasons.
Banks aren’t creating money now because they created too much of it in the past. The booms that preceded the crisis were fuelled by a wave of bank-debt-financed speculation on some useful products (the telecommunications infrastructure of the internet, the DotCom firms that survived the DotCom bubble) and much rubbish (the Liar Loans that are the focus of The Big Short). That lending drove private debt levels to an all-time high across the OECD: the average private debt level is now of the order of 150% of GDP, whereas it was around 60% of GDP in the “Golden Age of Capitalism” during the 1950s and 1960s—see Figure 1.
Figure 1: The private debt mountain that has submerged commerce

In the aftermath of the Subprime bubble, credit-money creation has come to a standstill across the OECD. In the period from 1955 till 1975, credit grew at 8.7% per year in the United States; from 1975 till 2008, it grew at 8% per year; since 2008, it has grown at an average of just 1.5% per year. The same pattern is repeated across the OECD—see Figure 2. Globally, China is the only major country with booming credit growth right now, but that will come crashing down (this probably has already started), and for the same reason as in the West: too much credit-based money has been created already in a speculative bubble.
Figure 2: Credit growth is anaemic now, and will remains so as it has in Japan for 25 years

Japan, of course, got mired in this private debt trap long before the rest of the world succumbed. As Figure 1 shows, its private debt bubble peaked in 1995, and since then it’s had either weak or negative credit growth, so that its private debt to GDP level is now in the middle of the global pack. Economic growth there has come to a standstill since: Japan’s economy grew at an average of 5.4% a year in real terms from 1965 till 1990, when its crisis began; since then, it has grown at a mere 0.4% a year.
That gives us a simple way to perform a “what if?”. What if the rest of the OECD is as ineffective at escaping from the private debt trap as Japan has been? Then the best case scenario for global credit growth is that it will match what has happened since Japan “hit the credit wall” in 1990.
We can guess at that by shifting Japan’s credit growth data forward 18 years, since its crisis began in 1990 while the rest of the world landed in the trap in 2008. Figure 3 shows the result of that exercise—here measuring credit growth as a percentage of GDP—and that predicts an average growth of credit from now till 2035 of 0.5% of GDP a year.
It’s worse still when you consider that most of Japan’s post-crisis credit growth occurred in the first half decade or so after its crisis. Take those early post-crisis years out, and the average rate of growth of credit in Japan has been minus 3 percent of GDP a year. Rather than adding to the money supply, banks have been reducing it for the last 20 years.
Figure 3: Predicting future OECD credit growth on the basis of Japan’s record for the last 18 years.

What about governments? Here we run into a problem with ideology—and bad metaphors. Inspired by visions of a no-government, free market idyll, conservative politicians from Reagan and Thatcher on have promoted restraints on government spending, in the hope that slashing government expenditure will allow the more efficient and dynamic private sector to fill the void. So the pressure has been on to reduce the size of the government sector, to avoid running deficits, and preferably to run surpluses, on the argument that the government is “like a household” and should “live within its means”.
This vision would be all very well if we lived in a barter-based economy, but we don’t. In such an economy, exchanges could occur in kind—your pigs for my computers. But in the real world in which we live, trading pigs for computers—or anything else—requires money. And a government deficit, when it is financed by the Central Bank buying Treasury Bonds, is the other way that money is created. The fetish for small government and budget surpluses means that the government has ignored this task, and effectively abrogated money creation to the private banking sector.
This strategy had no obvious negative consequences while the private banks were on a credit-money-creation binge—as they were effectively from the end of WWII till 2008. But once private debt began to dwarf GDP and the growth of credit slowed to a trickle, the inherent stupidity of this policy became apparent. In their attempt to promote the private sector, conservative proponents of small government are actually strangling it.
As someone who spent 2 years warning about this crisis before it happened, and another 8 years diagnosing it (and proposing remedies that would, I believe, be effective, if only banks and governments together would implement them), I find this dual idiocy incredibly frustrating.
Rather than understanding the real cause of the crisis, we’ve seen the symptom—rising public debt—paraded as its cause. Rather than effective remedies, we’ve had inane policies like QE, which purport to solve the crisis by inflating asset prices when inflated asset prices were one of the symptoms of the bubble that caused the crisis. We’ve seen Central Banks pump up private bank reserves in the belief that this will encourage more bank lending when (a) there’s too much bank debt already and (b) banks physically can’t lend out reserves.
How much longer can governments (and banks) continue with failed policies?
On Japan’s record, the answer appears to be “indefinitely”. Japan’s latest inane attempt to reflate its economy was announced just last week: it will now charge negative interest rates on the excess reserves that Japanese banks now hold in their accounts at the Central Bank. The only direct impact of this policy will be to drive up asset prices yet again—and it might even lead to private banks increasing interest rates on loans to the private sector, as has happened in Switzerland. The net effect on the real economy will at best be trivial, and it will do naught to reduce Japan’s private debt burden, which is the nub of its stagnationist problem.
We are hostage to a dysfunctional monetary system, run by people who don’t understand how it works in the first place. No wonder the global economy is in the doldrums, and finance markets are having dyspeptic attacks.

- The Number Everyone's Been Waiting For: Chinese Reserves Plunge By $100BN – What Does It Mean For Markets?
As we previewed on Thursday, the biggest event of the week, and perhaps of the month, was not Friday’s nonfarm payroll report, but the January update of China’s FX reserves, which the PBOC released last night. The number came out at $3.2309 trillion, down $99.5 billion from the prior month, and $8 billion less than the December outflow of $107.6 billion.

And even as China added $3.4 billion to its gold reserves, which rose to $63.6 billion or an increase of half a million ounces to 56.66 million, this reduced the total amount of Chinese foreign reserves to the lowest level since May 2012, and down from the $4 trillion peak in the summer of 2014 when the US Dollar started its rapid appreciation on rate hike concerns, and led to nearly a trillion dollars in Chinese capital outflows.

Recently, an important question that has emerged is for how much longer can China sustain its FX intervention before tapping out and letting the hedge funds win with their short Yuan bets once total reserves drop below the critical redline of approximately $2.7 trillion as calculated by the IMF – the answer is between 5 months and 10 months assuming monthly reserve burn rates of $130BN to $60BN.
That, however, is a bridge we will cross some time in the summer of 2016.
For now the real question is what does the January Chinese FX outflow mean for risk come Monday’s open, and how will it affect markets when they start opening tonight, if not in China which is closed for the week for its new year celebrations.
Recall that in our Thursday preview we warned that according to one of the more prominent bears from BofA, Michael Hartnett, had the reserve outflow come in well below expected, it would unleash a “vicious bear market rally.“
This is what we said:
According to consensus estimates, China will report that its total FX reserves declined to $3.2125 trillion from $3.33 trillion: a drop of $118 billion, or modestly higher than the massive December $108 billion outflow.
In other words, a reported number below, and certainly substantially below, $118 billion for the January outflow and it would be off to the races as a massive short squeeze will grip all the commodity and materials-linked sectors.
That said, keep in mind that BofA itself had a far more optimistic forecast than consensus:
“We forecast China FX reserve changes and estimate a USD37.5bn fall in January – (USD29.1bn decline adjusting for a negative FX valuation effect). Note that the standard error of the forecast is large at USD24.5bn, which would give us a downside of USD84.5bn fall. We caution that this is guidance and we attempt to be as transparent as possible so investors can gauge the odds in what is a key release for the markets. Note too this is based on onshore CNY FX volumes and our estimate maybe biased down as there are no real time volumes for offshore CNH.

And then there was Goldman, because just as a far smaller than expected number would be very bullish, so a far greater outflow would be bearish. According to estimates by Goldman Sachs, not only did outflows not slow down as dramatically as BofA believes, but they in fact soared to an all time high $185 billion in January.
This is what Goldman said: “There has been around $USD 185bn of intervention (with the recent intervention predominantly taking place in the onshore market)” split roughly $143 billion on the domestic side and $42 billion on the offshore Yuan side.” In the last few days, Goldman actually bumped up this forecast to $197 billion to account for valuation adjustments.

This is how we concluded:
So there is your bogey, one which will set the mood for risk over the next month: this weekend, China will announce its January reserve outflows which are expected to decline by about $120 billion. Should the number be far less (ostensibly closer to BofA’ estimate of $37.5 billion) expect a whopper of a bear market rally coupled with a huge short squeeze. If Goldman is right, however, with its record ~$200 billion in FX intervention and implied outflows, then all bets are off.
The actual number (whether it is fabricated or not, and since this is China, all bets are on the former) came in at $100 billion, modestly below the consensus estimate of $120 billion, well below the Goldman worst case scenario of $197 billion, and well above the BofA “best case” of 37.5 billion.
Or smack in the middle of a Goldilocksian no man’s land.
What does it mean for markets? Ironically, this may have been the most unfavorable outcome, because had China admitted the true severity of its outflows, there would have been a downward flush in asset prices, after which the market could focus more on fundamentals and rise from there with the Chinese capital outflow threat no longer dangling overhead; alternatively, a shockingly small number would have crushed the shorts only to let them re-establish bearish positions after the initial spike higher.
As it stands now, however, what is really happening with the biggest risk factor to commodity, credit and capital markets, remains a mystery, and instead of getting some much needed clarity from China’s January reserve number, the world’s traders and investors will now have to wait for the February reserve update one month from now to learn if China has managed to slay its capital outflow demons, or if these were just getting started.
For markets, what this means is that the next month will likely be market by more of the same sharp, illiquid volatility that has characterized 2016 so far.

- What The Charts Say: "Now Is The Time To Worry"
Submitted by Lance Roberts via RealInvestmentAdvice.com,
RALLY FAILS, ALERTS RISE
Last week, I discussed the boost the market received as the BOJ made an unexpected move into negative interest rate territory combined with end of the month buying by portfolio managers. To wit:
“However, the announcement by the Bank of Japan (BOJ) to implement negative interest rates in a desperate last attempt to boost economic growth in Japan was only the catalyst that ignited the bulls. The “fuel” for the buying came from the end of the month portfolio buying by fund managers.”
But more importantly, was the push higher by stocks that I have been discussing with you over the last couple of weeks. To wit:
“Over the last few weeks, I have suggested the markets would likely provide a reflexive rally to allow investors to reduce equity risk in portfolios. This was due to the oversold condition that previously existed which would provide the “fuel” for a reflexive rally to sell into.
I traced out the potential for such a reflexive rally two weeks ago as shown in the chart below.”
Previous Chart

As I stated then, the most important parts of the chart above are the overbought / oversold indicators at the top and bottom. The oversold condition that once existed has been completely exhausted due to the gyrations in the markets over the last couple of weeks. This leaves little ability for a significant rally from this point which makes a push above overhead resistance unlikely.
“Just as an oversold condition provides the necessary “fuel” for an advance, the opposite is also true.”
Here is the problem. I have updated the chart above through Friday’s close.

The rally failed at the previous reflex rally attempt during the late December/January plunge. This failure now cements that high point as resistance. Furthermore, the market continues to fail almost immediately when overbought conditions are met (red circles), which suggests that internals remain extraordinarily weak.
HEAD & SHOULDERS – NOT JUST DANDRUFF
The good news, if you want to call it that, is that the market is currently holding above the recent lows as short-term oversold conditions once again approach. It is critically important that the market holds above that support, which is also the neckline of the current “head and shoulders” formation, as a break would lead to a more substantive decline.

However, this isn’t the first time that we have seen a “head and shoulders” topping pattern form COMBINED with a long-term major sell signal as shown above. I emphasize this point because many short-term technicians point out “head and shoulders” formations that consistently do not lead to more important declines. However, when this topping process combines with enough deterioration in the markets to issue long-term “sell signals,” it is something worth paying attention to.
The first chart shows the same development in 2000.

And again in 2007.

These are the only two points since the turn of the century where a topping process was combined with a long-term sell signal.
It is important to note that in both previous cases the markets did provide one last chance to exit before a more substantiative decline ensued. This is because by the time the market has declined enough to break the neckline, sellers have been temporarily exhausted. This allows the market to rise enough to test previous resistance where “sellers” once again emerge.
It is very likely that if, or when, the market breaks current neckline support, individuals will be given one last chance to exit the markets for safer ground. A failure to do so has previously been the start of the “trail of tears.”
PREDICTING OR PAYING ATTENTION?
Last night I gave a presentation to a group of doctors discussing the economy, the markets and what is most likely to come over the next few months.
One of the questions I was asked during the Q&A section was:
“How can you be so sure that you are right? No one can time the market?”
It is an interesting question, and one that I have been asked before. If you scroll down to the bottom of this report you will see a chart of the S&P 500 with the history of portfolio adjustments over time. You could call this timing, however, I prefer to call this risk management.
For me, “timing the market” is trying to be “all in” or “all out.” If you try and do that playing poker you are eventually going to go broke.
However, a good poker player understands the “risk of losing” given the particular hand that he is dealt. He will bet much heavier given a “full house” versus a “pair of deuces.” However, even given a great hand, a good poker player reads the other players at the table and adjusts his bets accordingly.
The same is true when it comes to managing your portfolio. While you may have a “great hand of stocks,” you must read the rest of the players in the market. If they are all buying or selling, what do they know that you possibly don’t.
So, that brings me to the question above. I am NOT sure that I am right.
However, since last May I have held exposure in portfolios to 50% of normal equity allocations because the price trends of the market have been deteriorating. Furthermore, they continue to do so which is leading me to reduce allocations even more (see next section.)
Am I predicting a major market decline? NO. However, I am suggesting that given the current weight of evidence that one may very likely already be in process. The chart below is a MONTHLY chart of market indicators that measure a variety of market internals. Currently, every single measure is registering a “SELL” signal which has only occurred during the previous two bull market cycles.

Now, you can certainly make the case for why “this time is different.” However, if you are a good poker player, should you really be betting heavily given the current hand?
Even if correction only reverts back to the previous peaks of the past two bull markets, such would entail an additional decline of 18% from current levels, or 27% from the previous peak. Such a correction would just about meet the average draw down of a bear market cycle throughout history as shown in the table below.

Are you ready for that?
IS NOW A TIME TO WORRY?
Based on all the data above, not to mention deteriorating economic, fundamental and earnings as well, should you be worried about your investments?
I found this note from United Capital rather interesting (emphasis is mine):
“For anxious investors who want a quick answer to the question, the simple answer is, “No.” Now we’ll explain why. First, corrections are natural, normal, and we’d even say, necessary. I’ve gone through many of them, having started my career in investment management just two months before the 1987 crash.
While different circumstances led to each one, the fundamental aspect of a correction (or even a bear market) is that the market simply reprices securities to better match the underpinnings of an investment as they currently are.
Sometimes, this may happen because of a recession, which we do not think is the most likely scenario, but in many other cases, it’s simply because stocks got a little ahead of themselves. Right now, stocks in the S&P 500 are more expensive relative to their earnings than they historically have tended to be, according to Ned Davis Research. That means that investors bid up share prices more than (or perhaps one might even venture to say “earlier than”) they should have.
In that sense, a correction is just that: “correcting” a stock’s value to what the earnings and net worth of the company in question should dictate.”
This really goes to the root of why I am so fed up with the financial advisory industry as a whole. Let me translate the above for you.
“We don’t really manage your money. What we do is encourage you to buy some stuff and then sit on it so we can charge you a fee.
When prices decline, because we don’t really pay attention to the markets, we have to send out an excuse letter to keep you from transferring your money to another advisor who actually pays attention to what is going on.
Even though we knew stocks were overvalued, and such overvaluation leads to corrective cycles in the market, we really didn’t think about selling stocks to reduce the risk of loss. We are too busy trying to get other people to invest money with us. The more the better.
We hope you understand, but our revenue line is more important than yours. Oh, and please deposit more money in your account because dollar cost averaging works better for us than you.”
I realize that is a bit harsh, but I want to make a point. I know some really great advisors that work extremely hard for the clients, manage risk and try to ensure their clients reach their goals. If you ever read a site like Seeking Alpha, you will see a lot of them. Then there are these guys which give the rest of the industry a bad name.
Let me be clear with you. YES, it is time to worry, and it may be time to worry a lot.
If I am wrong, and the markets turn around, we can ALWAYS buy stuff and sit on it again. But now is not that time.
Apparently, if you don’t take some action with respect to the risk in your portfolio, no one else is going to either.
THE MONDAY MORNING CALL
As stated above, the market bounce failed much sooner than anticipated. This changes the tone of the market to substantially more bearish.
As shown in the chart below, on a very short-term basis the market is oversold and once again suggests the markets could get some buying early next week. However, they are also on the verge of breaking critical support.

I continue to suggest taking actions to reduce risk in portfolios by taking the following actions on ANY RALLIES:
- Trim back winning positions to original portfolio weights: Investment Rule: Let Winners Run
- Sell positions that simply are not working (if the position was not working in a rising market, it likely won’t in a declining market.) Investment Rule: Cut Losers Short
- Hold the cash raised from these activities until the next buying opportunity occurs. Investment Rule: Buy Low
One other point. The two moving averages in the chart above are the 200-day and 400-day. As you will notice they are about to cross. Because these two moving averages are so long in nature, THEY WILL CROSS. It is now inevitable UNLESS the market immediately reverses to a runaway stampede higher.
This “real death cross” was brought to my attention earlier this week by a loyal reader:
“Most identify the death cross as when the 50-day moving average breaks below the 200-day moving average on the S&P 500. However, the real death cross takes place when the 200-day moving average crosses below the 400. In 13 of the last 18 major correction episodes going back 1920- 72% this crossover marked the onset of a major Bear market.
In the five exceptions, which were 1953, 1990, 1984, 1987, and 1996, the same crossover actually ended the correction at that time. Importantly, these five episodes were during strongly trending SECULAR bull market cycles. Given we are not currently in one of those periods, it is likely a cross-over now would be more related to each of the market failures since the turn of the century.”

As I stated above, I am not “predicting” anything. What I am doing is suggesting that current trends, based on historical precedents, suggests that “something wicked this way comes.”

- Venezuela Prepares To Liquidate Its Remaining Gold Holdings To Pay Coming Debt Maturities
Last Thursday when we recounted the story of how Venezuela is now literally flying in paper money (using three dozen cargo Boeing 747s), we wrote that “Venezuela’s hyperinflation, already tentatively estimated at 720%, will likely add on a few (hundred) zeroes by this time next year. It is also quite likely that Venezuela the country, as we know it now, will no longer exist because once any nation is swept up in hyperinflationary rapids two things occur like clockwork: social uprisings and political coups.
But before it gets there, Venezuela’s president Maduro will be busy liquidating the nation’s roughly $12 billion in gold reserves, which his late predecessor fought hard in 2011 to repatriate back to Caracas. Sadly that gold was never meant to stay in Venezuela after all.“
And sure enough, just a day later, Reuters writes that Venezuela’s central bank has begun negotiations with the suddenly troubled Deutsche Bank to carry out gold swaps “to improve the liquidity of its foreign reserves as it faces heavy debt payments this year”, payments which it won’t be able to fund unless it manages to “liquify” its gold.
One look at Venezuela’s CDS which imply a 78% probability of default in the next year reflect the $9.5 billion in debt service costs this year.
The problem is that around 64% 15.4% of Venezuela’s $15.4 billion in foreign reserves, or around $10 billion, are held in gold bars, “which limits President Nicolas Maduro’s government’s ability to quickly mobilize hard currency for imports or debt service.”
As Reuters reminds us, in December, Deutsche and Venezuela’s central bank agreed to finalize a gold swap this year.
Technically, gold swaps allow central banks to receive cash from financial institutions in exchange for lending gold during a specific period of time. They do not tend to affect gold prices because the gold is still owned by Venezuela and does not enter the market.
The problem is that a swap when arranged with a technically insolvent nation is the equivalent of pledging gold for cash, which is precisely what Venezuela will do. Said pledge implies that once Venezuela has to fund the unwind of the swap, which will itself cost billions of dollars Maduro will not have, it will effectively hand over the gold to the counterparty, in this case Deutsche Bank.
Reuters also adds that according to its sources “Venezuela in recent years had been carrying out gold swaps with the Switzerland-based Bank for International Settlements (BIS) in operations ranging in duration from a week to a year. One source said Venezuela conducted a total of seven such transactions. BIS halted these operations last year, both sources said, as a result of concerns about the associated risks. BIS declined to comment.”
Meanwhile Venezula has been burning down its gold reserves:
Under the rule of late socialist leader Hugo Chavez, the central bank used billions of dollars in cash reserves to finance social programs and off-budget investment funds. This meant that gold became a larger percentage of reserves.
The value of Venezuela’s monetary gold has declined by $3.5 billion in the 12 months ended in November to reach $10.9 billion, central bank data shows. This appears to reflect swap operations and a 10 percent decline in the price of gold. It was not immediately evident if the central bank has also been selling gold.
The central bank in 2015 carried out a swap with Citigroup Inc’s (C.N) Citibank, according to one of the sources. Citi declined to comment in 2015.
And here is the punchline: “One of the sources said the central bank has taken an unspecified amount of gold out of the country so that it can be certified, which is required for gold that is used in such swaps. The gold lost its “certificate of good delivery” in 2011 when Chavez transferred it from foreign banks to central bank coffers, one of the sources said.“
In other words, after Maduro’s predecessor Chavez worked hard to repatriate the nation’s gold in 2011, Maduro is already doing his best to unwind all such actions, which while proving that gold is indeed money contrary to popular misconceptions by U.S. central bankers, will likely leave a bitter taste in the mouth of Venezuela citizens who will soon realize that their ruler sold off the country’s last remaining assets just to avert debt defaults for a few months.
Finally for those interested when the gold may officially change ownership, if only on paper for the time being, they should just keep track of Venezuela’s upcoming bond maturities, which include $1.5 billion 2016 Global Bond comes due at the end of February, while state oil company PDVSA faces payments of $2.3 billion on its 2017N bond in October and $435 million on its 2016 bond in November.

- Dot Com 2.0 – The Sequel Unfolds
The warning signs have been everywhere since the beginning, growing ever clearer with each new valuation round, IPO launch, and earnings cycle emanating from Silicon Valley.
Like a phoenix rising from the ashes of the post Dot-Com ruins people were told not only was it “different this time,” they were also instructed to observe even the phoenix bird itself had morphed into what is now commonly referred to as a “Unicorn.” And any comparisons to the prior meltdown in the land of Dot-Com were met with howls and scowls of, “You just don’t get it!” or worse.
The real issue was, it had nothing to do with “getting it.” It’s all been about Silicon Valley itself acting and arguing as if the past were irrelevant. Now many are coming to a very stark realization that the Valley may in fact once again have repeated all the same mistakes.
Far too many believed all their own press; and acted, spent, and mal-invested in ways that may eclipse the prior folly. Yes, welcome to Dot-Com 2.0. Where unicorns and more are bursting into spontaneous combustion in ways far more spectacular than previous. For it can all be viewed and commented on via the very creation that fueled it: Social media. I garner the news of this unravel will overtake these platforms with a speed, viewership, and voracity that could make the Kardashians jealous.
Another issue that will have an ever-increasing, devastating impact than The Valley currently realizes is: the all encompassing psychological impact such a bursting of a meme can spread and infect the minds of those that bought into all the fairy-tale hype, and pinned their tails on the Unicorn riches they assumed was surely theirs.
After all, if you listened to many now residing within the Valley one could argue that almost to a person today’s newest manifestation of millennial birthright is: Coding = A King’s ransom with a castle in the hills teaming with movie and rock stars, swim suit models, garages filled with exotic cars, and pools or fountains overflowing with champagne. All made possible with shares paid in lieu of salary at the next inevitable IPO cash out in perpetuity. Sadly, many are going to find out differently.
Back in October of 2015 I penned an article titled “Crying Towels: Silicon Valley’s Next Big Investment Op” In it I made the following statement:
“And this brings on a whole host of other meme shattering, break out the “crying towels” type arguments. For if it can happen there – guess where else it’s going to begin happening? Is ________________ next? Just fill in your current favorite high-flying Non-GAAP social darling on that line – for it’s going to happen at all of them very soon in my opinion. Much sooner than many now even think or ever thought possible.
“Coders” will gladly live in some single bed shared between 8 others apartment somewhere near the Valley. Heck. they’re now reporting stories how one can live in a shipping container on the cheap in San Francisco. Sounds fantastic right? Well, it is. As long as the dreams (and expectations) of landing the dream job in a start-up or similar where riches based in stock options and more are forthcoming or, dangled like carrots in front of wide-eyed dreamers.”
The proverbial warning shot became manifest when Twitter™ recently announced a 15% cut of exactly the type of staff or positions thought unimaginable just a year ago. i.e., Coders. Suddenly the very people once considered as “indispensable” and with an “inexhaustible need” unnervingly found that they were the first to go – in the first round of layoffs. This was the first visible prick to the meme-bubble bursting in my opinion. And as we all are becoming quite aware of: It’s far from the last, for the cannons have yet to begin firing in earnest.
Once high flyers such as the aforementioned Twitter and others are crashing to Earth like the proverbial canary. Companies like Square™, Box™, GoPro™, Pandora™, and now far too many others have watched their stock prices hammered ever lower. Yes, hammered, as in representing one selling round after another with almost no respite. Some have lost 90% of their once lofty high share prices.
What’s further disheartening to those still clinging (or praying) to the “meme-dream” is the ever-increasing reputation of the old “Great companies on sale!” chortles from many a next in rotation fund manager on TV, radio, or print. For it seems every round of selling is being met with ever more selling – no buying. And the lower they go with an ever intensifying pressure, so too does the value of the debutantes in waiting: The yet to be IPO’d unicorns.
Valuation after unicorn valuation are getting marked down in one fell swoops such as that from Fidelity™ and others. However, there probably wasn’t a better representation on how little was left to the unicorn myth (and yes I believed/believe all these valuation metrics were myth and fairy-tales) than the very public meme shattering experienced in both the IPO, as well as the subsequent price action of Square.
Here it was touted the IPO price was less than the unicorn implied valuation. This was supposedly done as to show “value” for those coming in to be next in line to pin their tails on the newest unicorn of riches. The problem? It sold, and sold, and is still selling – and not in a good way.
It seems much like the other company Mr. Dorsey is CEO of (and how anyone with any business acumen argued that was a good idea is still beyond me. But I digress.) this unicorn also can’t fly. And; is in a perilous downward spiral of meeting the ground of reality.
It seems the only interest in buying these once high flyers can garner is wrapped up into any rumor (usually via a Tweet!) that they are to be sold – as in acquired by someone else who might be able to make money with them. Well, at least that would free up the ole CEO dilemma, no?
And speaking of CEO dilemma and acquiring – how’s Yahoo!™ doing? Remember when the strategy for success for Yahoo as posited by the very public adoration styled magazine cover girl articles of its current CEO Marisa Mayer was an acquisition spree? This was all but unquestionable (and much digital ink spilled) in its brilliance and vision inspired forward thinking. Well, it seems all that “brilliance” has been eviscerated much like how the workforce still employed there is yet to be.
Let me be blunt: All you needed to know things were amiss both at Yahoo as well as “the Valley” itself was to look at the most recent decision of Ms. Mayer to throw a lavish multi-million dollar costumed theme party mere months ago. As unquestionably foolish as this was – the rationale given by many a Silicon Valley aficionado that it was nothing, after all, “it’s common in the Valley” was ever the more stupefying!
Now it seems Yahoo is “cutting its workforce by double-digit percentages.” And: open to the possibility of selling off core assets of its business. Of course – at the right price. However, I’d just offer this advice:
Don’t wait too long on that “right price.” For if the current value of Alibaba™ is any indication – “right” is becoming more inline with “any” much faster than anyone dared think just a year prior.
However, as much as all the above is concerning to anyone paying attention. (And it’s just a thumbnail sketch of the most obvious.) There are those who’ll argue that today is far different that the Dot-Com bubble of the late 90’s early 2000’s. Many will point to the amount of start-ups and other metrics as a tic-for-tat type of comparison. i.e., Unless there are 500 new IPO’s this week as opposed to let’s say 255 today (example #’s only) then today is in no way comparison to the Dot-Com bubble is the ensuing argument. And; anything further is met with deaf ears, blind eyes, or outright dismissal warranting the usual “It’s different this time, and you just don’t get it!” point of finality to the conversation much like a teenagers defiant stance of “Because, just because!”
Well, fair enough. However, if I might be so bold as to use one argument that has been used on people like myself to both shut down any further parsing of facts, or outright dismissal regurgitated by many a Silicon Valley aficionado countless times. That argument?
Marc Andreessen’s quote in his Twitter bio from Martin The Martian (one of my personal all time favorite cartoon characters I’ll add) “Where’s the kaboom? There was supposed to be an earth-shattering kaboom!” When talking about another bubble bursting.
The kaboom now has a name, place, and can be seen and heard by anyone brave enough to not avert their eyes or ears.
It’s called LinkedIn™.

- HaiL To THe DouCHe…


- Even The Fed's "Owners" Aren't Buying What Janet Is Selling
Despite a collapse in yields and implicit plunge in the odds of a rate-hike anytime soon, asset-gathering, commission-taking talking-heads continue to spew unrealities about the economy and where it goes next as excuse after excuse (low oil is good, services trump manufacturing etc) are discarded. What is worse is that none other than The Fed’s “owners” – the primary dealers – refuse to play along with The Fed’s transitory narrative as their Treasury Bond position is the longest since 2013.

Of course, as Bloomberg notes, the buildup in the 22 primary dealers’ Treasuries holdings, concentrated in maturities less than six years, may also signal more sales by central banks, said Subadra Rajappa, head of U.S. rates strategy at Societe Generale SA.
“This gels well with what we are seeing with China selling Treasuries, as dealers typically have to disintermediate the stress so they take these securities on their books,” she said. A similar spike occurred last year following China’s August currency devaluation and the subsequent drop in its reserves.
Although it appears that only the greatest fools are left holding the bag on a rising-rates, commodities-have-bottomed, stocks’ secular bull is still in place narrative.
Don’t Fight The Fed’s “owners”

- "Few Are Yet Willing To Admit The Harsh Reality…"
Excerpted from Doug Noland's Credit Bubble Bulletin,
Crude has rallied about 5% off of last month’s low. The Brazilian real closed Friday at 3.90, having posted a decent rally from the January closing low of 4.16 to the dollar. Brazilian equities have bounced about 10%. This week saw Brazil’s currency rally 2.4%. In general, EM currencies and equities have somewhat stabilized, notably outperforming this week. Stocks posted gains in Brazil, Turkey and China. From Bloomberg: “Yuan in Longest Weekly Rally Since 2014 as China Raises Rhetoric.” The dollar index this week dropped 2.6%, which most would have expected to lend some market support.
If crude, commodities, EM, the strong dollar and the weak yuan were weighing on global market confidence, why is it that global financial stocks have of late taken such a disconcerting turn for the worse?
Thursday headlines: “Credit Suisse posts first loss since 2008”; “Credit Suisse shares crash to 24-year low.” This week saw Credit Suisse sink 15.2%, pushing y-t-d losses to 30.4%. European financial stocks continue to get hammered, some now trading near 2009 lows. Notably, Societe Generale this week fell 8.7% (down 25% y-t-d), Credit Agricole 6.1% (down 21%) and Deutsche Bank 5.2% (down 30%). From Bloomberg’s Tom Beardsworth: “Credit-default swaps tied to subordinated debt issued by Deutsche Bank rose to the highest since July 2012…” The STOXX Europe 600 Bank Index dropped 6.2% this week, boosting y-t-d declines to 19.9%. FTSE Italia All-Shares Bank Index sank 10.1%, increasing 2016 losses to 30.6%.
February 4 – Bloomberg (Tom Beardsworth): “European banks and insurers’ financial credit risk rose to the highest in more than two years, following a $5.8 billion loss at Credit Suisse Group AG and signs of a slowdown in the global economy. The cost of insuring subordinated debt climbed by 19 bps to 254 bps, the highest since July 2013, based on the Markit iTraxx Europe Subordinated Financial Index. An index of credit-default swaps tracking senior financial debt jumped six bps to 110 bps. Both indexes have risen for six days in a row…”
Here at home, the banks (BKX) sank 3.9%, trading this week at an almost 30-month low (down 16% y-t-d). The broker/dealers (XBD) fell 4.0%, sinking to the lowest level since December 2013 (down 18.7% y-t-d). Citigroup and Bank of America both have y-t-d (five-week) declines of 23%.
Why didn’t the weaker dollar this week support financial stocks – and equities more generally? For one, long dollar is perhaps the most Crowded Gargantuan Trade around. And those EM currencies and equity markets outperforming this week had become popular shorts. With the leveraged speculating community now under intense pressure, there’s especially low tolerance/capacity for pain. It’s one eye on the exit time. At this point, rather than supporting stabilization, dollar weakness spurs further de-risking/de-leveraging – commodities and EM not withstanding. It’s reached the point where there is almost no place to hide. In the mirror image of financials, gold stocks are rather abruptly transforming from Crowded short to coveted store of value (HUI up 22% this week).
Financial stocks have mutated from market darlings to shorts. Such sensational shifts in market psychology are devastating for stock prices, market confidence and liquidity more generally. As “Risk Off” appeared to attain critical momentum, this week saw heightened panic out of Crowded favorites. The Nasdaq 100 (NDX) fell 6.0%, increasing y-t-d losses to 12.4%. The biotechs (BTK) sank 5.4%, raising 2016 losses to 28.1%. The Morgan Stanley High Tech Index was hit 7.2% (down 15.7% y-t-d). The small cap Russell 2000 lost 7.2% this week (down 13.2% y-t-d).
The ongoing worldwide collapse in financial stocks provides powerful support for the bursting global Bubble thesis. After a brief respite, this week saw contagion effects return with a vengeance. Last year’s commodities and EM downfall anticipated the faltering Chinese Bubble. These days, “developed” markets have begun to discount the vulnerability of Europe, the U.S. and the rest of the world to Bubble contagion effects originally emanating from the China/commodities/EM downturns. The dominos have started falling.
Few are yet willing to accept the harsh reality that the world has sunk back into crisis. The VIX ended the week at a somewhat elevated but non-crisis 23.38. Credit spreads have widened meaningfully but for the most part remain at a fraction of 2008 crisis levels. Indeed, markets remain hopeful that “whatever it takes” central banking is waiting in the wings to trigger rallies at the moment things turn disorderly. My view that crisis has reemerged is based on the analysis that de-risking/de-leveraging dynamics have reached a point of self-reinforcing momentum beyond the control of central bank policies. In short, The Adjustment Cycle has commenced and there’s little left at this point to hold it back.
A multi-decade Credit Bubble is coming to an end. The past seven years has amounted to an incredible blow-off top – China; EM; global government debt; “whatever it takes” central bank inflationism; QE infinity; zero and now negative rates; a $3.0 TN hedge fund industry; a $3.0 TN ETF complex; unprecedented global corporate bond excess; historic M&A, stock buybacks and financial engineering; derivatives Bubble resurrection; and tech and biotech Bubbles 2.0 (to name only the most obvious). Importantly, global financial and economic imbalances – already unmatched by 2008 – went to even more precarious extremes.
Bubbles inflate both perceived wealth and future expectations. Meanwhile, in the real economy sphere, myriad Bubble facets work to destroy wealth. Mal-investment, over-investment and associated wealth destruction remain largely concealed so long as financial asset inflation persists. This is true as well for wealth redistribution. The unfolding adjustment process will deflate asset prices so as to converge more closely with deteriorating underlying economic fundamentals.
Marking down Chinese debt to a more reasonable level will leave a gaping hole – in bank capital, in government finances and in household savings. This will set back China’s transformation from production to a services/consumption-based economy by decades. Mark down European debt and asset prices to sensible levels and the banking system is insolvent and Europe’s economy is right back in the ICU. Indicative of a faltering Bubble, European periphery spreads widened significantly this week (Greece, Portugal, Italy and Spain). Europe would be in much better shape today had it taken its medicine in 2012.
The U.S. economy has been perceived as the envy of the world. The bulls must be watching the big financial stocks in complete disbelief. I would argue that the U.S. has among the widest divergences between inflated financial wealth and deflating real economy prospects. It’s worth noting that Amazon and Netflix have lost more than a quarter of their value over the past five weeks. LinkedIn dropped 44% Friday.
The unfolding adjustment cycle will be especially burdensome for beloved companies that generate little or no profits/cash flow – and the Bubble has cultivated scores of them. And as equities prices and wealth deflate, faltering profits will soon follow. Industries, companies, combinations, entities, deals and structures – that looked fruitful in the age of abundant cheap finance and risk embracement – will now be viewed through a gloomy prism. Bond and derivatives investors will become much more cautious. Financial conditions will tighten significantly.
There’s a reasonable probability that global Credit growth is moving toward the weakest expansion in at least 60 years. U.S. Credit growth will be the weakest since at least 2009. And while Credit growth has slowed markedly in the U.S. over the past year, securities and asset prices (“perceived wealth”) over this period were bolstered by unprecedented international flows. “Money” has been fleeing China, EM, euro & yen devaluation, and the world more generally. At the same time, I suspect that hundreds of billions of leveraged speculative flows inundated “king dollar” U.S. securities markets.
This week had a king-dollar inflection point feel to it. There’s a problematic scenario that now seems a relatively high probability: De-leveraging/de-risking sees a reversal out of king dollar, while already tepid Credit growth slows sharply as markets falter and risk aversion takes hold. Financial stocks have already begun to discount this type of quite problematic backdrop for U.S. securities and asset prices. A disorderly unwind of leveraged positions concurrent with selling from derivative-related “dynamic” hedging programs would ensure market illiquidity and dislocation. And such a scenario could easily unfold concurrently on a global basis.
Kuroda was badly mistaken if he believed negative rates would weaken the yen (for more than hours). In a world of de-leveraging, there’s a strong case to be made that negative rates are worse than doing nothing. I’m assuming more QE will be forthcoming – from all major central banks. That’s certainly what the Treasury, JGB and bund markets are telegraphing.
Candidly, I don’t enjoy writing in these circumstances. It’s reminiscent of the buildup to the 2008 market crash. It wasn’t entirely clear how things would unfold back then, but I knew tens of millions would be badly hurt. Nowadays I fear for hundreds of millions, and the associated geopolitical… So far, the public hasn’t panicked. Why would anyone sell now when stocks always recover? The Adjustment Cycle is just getting underway.

- Mainstream Media Guide To Obama's Economic "Recovery"
- Google Or Apple, FactSet Asks "Who's Bigger"?
On the first day of this month, Google.. er, Alphabet.. turned in an impressive quarter.
Revenues soared 18% Y/Y while Q4 earnings were $8.67/share, well above the $8.08 the Street was looking for and a whopping $2 more than Q4 2014. Paid clicks rose by more than a third while FCF rose to $4.3 for the period. In short, just about everything looked great with the possible exception of CPC, which dropped 13%.
The stock jumped AH and just like that, Alphabet was the world’s most valuable stock, surpassing Apple. As we noted at the time, this happened on the same day that FaceBook blew past Exxon as the third most valuable stock.

“Everything’s working in [Google’s] favor right now,” James Cakmak, an analyst at Monness Crespi Hardt & Co said.
Since Monday, Apple regained the top spot in terms of market cap, but given the fanfare, it’s worth taking a look at how the two most valuable companies in the world stack up to the rest of the field on a variety of “trivial” things like revenue and net income.
That’s FactSet’s “topic of the week”, and as you’ll see below, when it comes to raking in money, nobody does it like WalMart.
* * *
From FactSet
Alphabet vs. Apple: Who is Bigger?
This past Monday after the bell, Alphabet reported EPS of $8.67 for Q4 2015, which was 7% above the mean EPS estimate. On Tuesday, Alphabet closed the trading day with a market value of $530.9 billion, which vaulted the company above Apple for the largest market value in the S&P 500 index. Since Tuesday, Apple has regained the top spot in in the S&P 500 index in terms of market value. However, the companies are ranked #1 and #2 on this list (based on yesterday’s closing prices) at this time. Given their top rankings in terms of market value, where do these companies rank in the S&P 500 in terms of largest revenues and largest earnings?
In terms of total revenues over the past four quarters (as not all S&P 500 companies have reported actual results for Q4 2015), Wal-Mart holds the top spot for the highest revenues at $484.0 billion. Apple holds the third spot on this list, with total revenues over the past four quarters of $233.3 billion. Alphabet is ranked #33 on this list, with total revenues over the past four quarters of $74.2 billion.
In terms of net income over the past four quarters, Apple holds the top spot for highest net income at $53.7 billion. Alphabet holds the ninth spot on the list, with total net income over the past four quarters of $16.4 billion.
At this point in time, Apple is a larger company than Alphabet in terms of market value, total revenues, and total net income.


* * *
So there you have it. Are Apple and Google dominate when it comes to market cap and net income? Yes.
Can they compete with Sam Walton on gross sales? No. Not even close.
Of course that discrepancy should tell you something about why WalMart needs to shutter 269 stores and fire 16,000 people. When you outsell Exxon Mobil 2 to 1 and are nowhere to be found in the top 10 companies by net income you know you are playing with the thinnest of margins.

- Super Bowl 50 – What Has Changed In The US Since 1967
America has changed a lot since Super Bowl 1 in 1967 but, as the cost of tickets, airfare, commercials, and beer have soared, real median incomes have risen just 9%… is it any wonder the 'people' are revolting.. towards Bernie and The Donald? However, the economics of Super Bowl 50 are every bit as cloudy as the general American economy… which looks set to be re-named "The Unicorn Bowl."
Distraction – Nearly 1 in 4 are watching just for the commercials…

No matter what – you better watch anyways, because the winner of the Super Bowl will determine if stocks are heading up or down in 2016.
Are you a Carolina Panthers fan? You might want to start buying stocks. Denver Broncos fan? Better start selling.
- A win by an original National Football League team—from the days when there was an NFL and an American Football League, before the 1966 merger pact—means the market will be up for the year.
- A win by a descendant of the AFL sends the market down.
- Teams created since the merger count for their conference, National or American.

But away from Wall Street, the American man's REAL median income has gone up by only 9% over the last 50 years, and, as The Burning Platform's Jim Quinn exclaims, that is using the blatantly fake CPI calculation. Using a true measure of inflation would reveal that men make less money today than they did in 1967. And the MSM & corrupt politicians wonder why so many people are so pissed off.

But, as ConvergEx's Nick Colas reports, looking at everything from aftermarket ticket prices to travel costs and ad spending shows that the economics of Super Bowl 50 are every bit as cloudy as the general American economy.
The “Get In” price to attend the game is currently $2,950 on Stubhub, down 11% from last year’s $3,300/seat. Average ticket prices are, however, higher at $6,007 versus $5,684 in 2015 (a 6% bump). The former is essentially “Bucket list inflation”, and lower prices signal a weaker mass-affluent consumer. Higher averages mean more high net worth/corporate interest in the Big Game, and that extends to ad prices and other expenditures. A 30-second ad costs $5 million, a new record and 11% higher than last year’s $4.5 million.
Lastly, that the Super Bowl is in San Francisco this year means you might as well call it the Unicorn Bowl. Uber reportedly paid at least $250,000 in sponsorship to get access to a remote parking lot to use on Sunday. No word on surge pricing, however.
“Old age and treachery beats youth and exuberance.” That’s an old saying on Wall Street, but it’s not transferring too well to the gridiron. ESPN reported today that Cam Newton is the current favorite in Las Vegas to win the Super Bowl 50 Most Valuable Player title. His odds sit at 5-7, versus Peyton Manning at 7-2. This is the first year Nevada sports books are allowing wagers on the winner of the MVP, and so far the crowd likes youth over experience.
Over the past 6 years we’ve looked at the Super Bowl as not just a marquis event in the American sporting calendar but also as a unique window into the country’s economic life as well. For many well-heeled football fans, getting to the “Big Game” is something of a bucket list item. That demand pushes up against the inherently limited supply of tickets, airplane seats, hotel rooms, and other amenities. On a larger scale, the Super Bowl regularly draws the largest TV audience of any event, sporting or otherwise – some 114 million people last year. In an increasingly fractured media world, that reach is ever more valuable.
What we found this year echoes the push-me-pull-you message of other, more standard, economic indicators. Here’s our list of Super Bowl indicators, with comparison points to prior years:
#1 – Ticket Prices. The face values of Super Bowl tickets are basically unchanged from last year, at $850-$1,800 in 2016 versus $800 – $1,900 in 2015. Only a fortunate few get to pay that price, however. The rest go to the ticket brokers.
There, it is a “Tale of Two Super Bowls”. For the bucket listers out there who just want to experience the game, the cheapest seats are less expensive now than last year. We found a ticket in Section 401 (upper tier) for $2,950 on Stubhub. That is less than $3,300 we logged as the “Get In” price last year. Prior year cheapest-available prices were: $1,242 (in New York, 2014), $1,769 (2013, New Orleans), and $2,000 (2012, Indianapolis).
In contrast, average ticket prices, which we assume are more heavily influenced by corporate spending and high net worth fans, are up. This year the mean price on Tiqiq is $6,007 versus $5,684/seat for the game last year in Arizona. Prior year averages were: $2,505 (2014), $3,398 (2013), and $4,000 (2012).

The upshot here seems straightforward: the average football fan/bucket lister seems a little more price sensitive this year, with Get in prices down about 11%. Corporates/more affluent fans who would like prime seating are willing to pay more – about 6% more – than last year.
#2 – Airfare. We always see price increases for airfare to the host Super Bowl city around the dates of the game. The only real question is “How much” relative to fares 2 weeks later when things return to normal.
Here, the story is generally better for the travelling football fan than in prior years. Wall Streeters who want to fly to San Francisco this weekend will pay $822 for a direct flight, or 2.7x more than the same journey in 2 weeks’ time. Charlotte fans will pay $1,197 for the same trip from their home town, or 2.3x more than two weeks from now. Both are less than the “Typical” Super Bowl market we’ve measured over the past 5 years at 2.9x. New Orleans 2013 was the worst Super Bowl for the fly-in fan, at 4.4x the normal rate. Bad news for Denver fans, however: flights to San Francisco are $892 this weekend but $186 in two weeks’ time. That 4.8x spread is the worst we’ve seen in 5 years for any participating city travel to the host venue.
#3 – Hotels. Since San Francisco is the home of Airbnb, you’d assume there would be loads of extra space for visiting fans and hotels would have no pricing power. Not so much… Press reports (see links below) quote locals as saying Airbnb asking rates are coming down this week. Hotels, by contrast, are holding the line. The Hilton Santa Clara wants $1,999/night for this weekend, up from $287/night in two weeks. If you are the bucket list plan, consider the Extended Stay America in downtown San Jose: $149/night, close to its 2-week-hence price of $119/night.
#4 – Ad Spending. While the consumer side of Super Bowl 50 is a mixed bag, the media story is fantastic. Thirty second spots cost $5 million, up from $4.5 million last year and $4 million the prior three years before. That breakout stems from the increasing popularity of the game, which last year had 114 million people tuning in.

#5 – The Unicorn Bowl. San Francisco hasn’t hosted a Super Bowl since 1985 when the game was held in the +60 year old Stanford University stadium. Now, the Valley is anxious to show the world, or at least +114 million Americans, that it can put on a great tech-enabled show. SAP developed an app for the 7,000 volunteers that will provide logistical support for the weekend. Google has a “Road to 50” app for visitors this weekend. Verizon is turning up the bandwidth on its local 4G LTE system. Even Super Bowl network CBS is getting in to the tech spirit, with a new camera system and (believe it or not) a new logo.
But perhaps the most telling signal is the price of something much more prosaic: parking. Every sports fan knows that securing a great parking spot – near an exit with easy access to a highway heading home – is the key to a first class experience. Uber, the ride sharing app, knows it too. That’s why they are paying somewhere between $250,000 and $500,000 to sponsor the Super Bowl Host Committee in return for access to a remote parking lot near the stadium. They will also have expedited service after the game.
No word on surge pricing, of course…
* * *
And finally, in the interests of full disclosure – Go Broncos, Go Coach Knapp!!


- Another Exponential Chart: Record Numbers Renounce Their U.S. Citizenship In 2015
Another year, another record number of Americans willing to not only pay the $2,350 fee, but also appear in the US Treasury’s “name of shame” list published every, quarter which reveals all the now-former US citizens who have decided to hand over their US passport back to Uncle Sam and expatriate.
According to the latest US Treasury report, a record 4,279 individuals decided to give up their citizenship in 2015, up 864 from the previous full year record of 3,415, and up a stunning 560% from the peak hit during the Bush administration years. The latest Treasury report contains the names of the 1,058 former US citizens and permanent residents who gave up their passports in the period from September to December.
Below is a recent chart of showing the number of US expats over the past 10 years:

As Forbes adds, while clearly showing a troubling trend in the soaring number of expats, the published list is also incomplete, with many not counted. Surprisingly, no one seems to know exactly how big the real number is, even though the IRS and FBI both track Americans who renounce citizenship.
The main cause for the massive increase in renunciations is believed to be the Foreign Accounts Tax Compliance Act (FATCA), which came into force in 2010. The law imposes harsh penalties for non-compliance, even if people aren’t dodging it on purpose, Andrew Mitchel, an international lawyer who analyzes IRS data, told the Wall Street Journal.
FATCA has ramped up worldwide and requires an annual Form 8938 filing if foreign assets meet a threshold. Foreign banks are sufficiently worried about keeping the IRS happy that many simply do not want American account holders. Still, leaving America can be costly. To exit, you generally must prove 5 years of IRS tax compliance. Plus, if you have a net worth greater than $2 million or have average annual net income tax for the 5 previous years of $160,000 or more, you can pay an exit tax.
“An increasing number of Americans appear to believe that having a US passport or long-term residency isn’t worth the hassle and cost of complying with US tax laws,” Mitchel said.
At the time, President Obama hailed the law as a “global standard” in countering tax evasion. It was passed by Congress in the wake of a scandal involving UBS AG bank, following disclosures made by banker–turned-whistleblower Bradley Birkenfeld in 2009. He testified that UBS had enabled its American customers to defraud the US tax authorities. The revelations forced UBS to admit it had encouraged illegal financial activity and was obliged to pay a staggering $547 million to settle the case.
Ironically, until the recent disclosure by Bloomberg following up on our own reporting about US tax havens such as Reno, Nevada which have been converted by financial olligarch families like the Rothschilds into their own personal tax evasion backyards, little did the world know just how far US hypocricy could stretch, in that while Obama was destroying tax havens around the globe and especially in Switzerland with FATCA et al, the president was quietly converting the US into the world’s biggest hot money and tax-laundering haven in the world.
Finally, while we showed the past decade of US expats above, few charts do the topic of US citizenship renunciation justice, like the one shown below, courtesy of Andrew Mitchel.

For those curious, this is what the Federal Register’s “name shame” list looks like.

- Dear Barack… You Forgot To Mention A Few Things
Submitted by Gary Kaltbaum via GaryKaltbaum.com,
While my President was out this week patting himself on the back and taking victory laps over the "supposed" 4.9% unemployment rate, he forgot to mention a few important tidbits about what is really going on. We used to call them termites…the termites that were eating away at the economy because of foolish monetary policy by assinine central banks and even worse policy emanating out of this administration…but they are no longer just termites. The eating away of the economy has given rise to serious problems already front and center as well as the problems to come. But there was no mention of these FACTS by my President! It is simple! You cannot "easy money" your way to longer-term economic Shangri-la. You cannot tax and spend your way into a longer-term strong economy. You cannot create massive amounts of mandates, regulations, fees, fines and all that crap and turn it into longer-term strength that will feed on itself.
My President forgot to mention:- The labor participation rate has conveniently continued to crash since the administration took over enabling the unemployment rate to be lower than reality!
- This administration and the economy has been the recipient of 0% rates since becoming President…the recipient of $4 trillion-plus of printed money here and depending on the abacus you are using, $15-20 trillion of printed money around the globe…leading to a responding market to all the printed money creating a faux wealth effect that now goes into reverse. Very simply, the easiest monetary policy in the history of time!
- Deflation almost everywhere except for your healthcare premiums and deductibles.
- GDP under 1%.
- The Baltic Dry Index hitting another new all-time record low.
- U.S. factory orders that have now dropped for 14 months in a row.
- Orders for class 8 trucks (the big ones) declining a measly 48 percent from a year ago.
- Junk bonds continuing to crash!.
- The Restaurant Performance Index falling to the lowest level since 2008.
- A major slowdown in rail traffic!
- Corporate profit margins peaking during the third quarter of 2014 and heading lower since.
- Food stamp beneficiaries…at or near all-time highs.
- Homelessness…not good!.
- Welfare spending…a measly $1 trillion/year through over 80 different federal programs.
Retail crashing:
- Wal-Mart is closing 269 stores, including 154 inside the United States.
- KMart is closing dozens of stores.
- JC Penney shutting down almost 100 stores.
- Macys shutting 36 stores.
- The Gap closing 175 stores.
- Aeropostale clsoing 84 stores.
- Finish Line closing 150 stores.
- Sears shutting 100s of stores.
- Massive sales and earnings misses by Kohls, Bed Bath and Beyond, Best Buy, Ralph Lauren and many others. All this while oil prices have crashed.
And of course:
Creation of $8.4 trillion of new debt under your watch! That's over and above the already assinine amounts of taxpayer dollars you receive. That's after you saying you would go line by line through the budget to root out all the waste and stating you would cut deficits in half.
Despite you saying you lowered the deficit by 50%, you forget to mention it was you who inflated the deficit in the first place.
The CBO now says deficits are going to double to back over $1 trillion/year very soon…and total debt will head into the high $20s (trillion)!
Lastly…the markets. The markets, being a great forecaster of the future…well, let's hope this time the markets are wrong!

Mr. President, we wish we could say you are leaving us with a rotting economy… but we are worried we are past the point of rotting as you leave this country much more in debt than when you came in. Anyone can become rich by getting an infinite amount of credit cards and maxing each one out before receiving the next one. It just never ends well. Someone always pays in the end!* * *
Still buying the "hope"? Still think the skeptical naysaying non-patriots are "peddling fiction"? Well 9 charts paint a thousand words…


- 2016 EPS Growth Estimates Slashed By 50% Just One Month Into The Year
Several days ago, we showed the one chart which explains why Bank of America remains a stubborn non-BTFDer. This is what Michael Hartnett said last Thursday: “We remain sellers into strength in coming weeks/months of risk assets at least until a coordinated and aggressive global policy response (e.g. Shanghai Accord) begins to reverse the deterioration in global profit expectations (currently heading sharply south – Chart 1) and credit conditions.”

Since then things appear to have gotten even worse, because while not only is the almost concluded Q4 earnings season on pace to confirm yet another earnings recession, with a blended earnings decline of -3.8%, which according to Factset “will mark the first time the index has seen three consecutive quarters of year-over-year declines in earnings since Q1 2009 through Q3 2009“, but both Q1 and Q2 2016 are looking just as bad: as Factset notes in its latest weekly update, “in terms of earnings, the estimated declines for Q1 2016 and Q2 2016 are -5.3% and -0.4%.”
Putting this in perspective, just over a month ago, on December 31, 2015, the consensus for Q1 EPS was a growth of 0.8% vs a year ago. It is now down -5.3%…

… while revenues are likewise expected to drop by -0.1% compared to forecast incrase of 2.6% as of December 31.

As Factset then notes, as is usually the case, analysts are predicting significant increases in earnings and revenue growth in the 2nd half of the year. In terms of earnings, the estimated declines for Q1 2016 and Q2 2016 are -5.3% and -0.4%, while the estimated growth rates for Q3 2016 and Q4 2016 are 5.5% and 10.7%. In terms of revenues, the estimated declines for Q1 2016 and Q2 2016 are -0.1% and -0.1%, while the estimated growth rates for Q3 2016 and Q4 2016 are 2.3% and 4.5%.
In other words, hockey sticks that would make any central bank proud. The only problem is that these forecasts will never materialize, which can be seen in the full year EPS forecast below. As highlighted in the box below, in just one month full year EPS has declined from 4.3% to 2.2%.

We open it up to readers to determine in how many weeks will full year 2016 EPS be revised tom 4.3% as of the start of the year, to 2.2% currently, to negative, indicating at least 7 consecutive quarters of declining EPS, something not recorded even during the peak of the financial crisis.
Incidentally, an earnings recession is two consecutive negative quarters of EPS: we don’t know what the technical term is for seven…

- Crunch Time?
Submitted by Paul Bordsky via Macro-Allocation.com,
It seems monetary policy is exhausted and the next exogenous lever to pull would be political fiscal initiatives. If/when they fail to stimulate demand, there would be only one avenue left – currency devaluation. If/when confidence in the mightiest currency wanes, we would expect the US dollar to be devalued too – not against other fiat currencies, but against a relatively scarce Fed asset.
Seriously Squirrely
On February 3, New York Fed President Bill Dudley noted financial conditions are considerably tighter than when the Fed hiked rates in December, and, though its members are not yet ready to draw conclusions about the policy path, the FOMC will surely consider such tightening financial conditions in its future deliberations. He further noted that a weakening of the global economy and additional dollar strength could have significant consequences for the U.S. economy. Bingo.
It seems we have been on the right path by arguing the Fed has taken control of dollar policy. Less clear is that the Fed acknowledges an inevitable global de-leveraging, and in such an environment a strong dollar would attract global wealth and capital to the US, which in turn would fund bank deposits and capital markets. (It is unlikely the Fed would acknowledge such a policy so economically hostile to its trade partners.)
To be sure, Dudley’s is a voice to heed. The New York Fed has a very special role in the Federal Reserve System. Not only does its president have permanent FOMC voting privileges, but the New York Fed represents Wall Street, and perhaps more significantly, the Fed’s majority shareholders. One could reasonably suspect that with Fed board members Daniel Tarullo and Jerome Powell, who generally do not comment on Fed policy, Dudley’s remarks reflect the willingness of core financial operators to endure less than optimal lending and/or yield curve conditions.
Weakening US and global credit and equity markets are hinting that policy makers may be losing their grip on the general perception that they have the collective ability to control demand and output growth. This week, the European Commission reduced its forecast for 2016 and 2017 growth in the UK. The Bank of England left its policy rate unchanged and signaled its intention to hike rates is less straightforward than it used to be.
Meanwhile, in the US this week productivity fell sharply, jobless claims were again higher than trend, but the unemployment rate fell to 4.9%, average hourly earnings rose sharply (2.5% year-over-year), and hours worked expanded. Such wage inflation provides the Fed cover to normalize rates further, which we argue it wants to do to maintain a stronger dollar.
Despite the rhetoric coming from monetary policy makers and whatever economic releases may be used to support their objectives, the real economy will do what it will do. Global trade continues to wane. The Baltic Dry Index (below) is plumbing five year lows.

Growing evidence suggests that the global economy is rolling over, as has been our core view, and that global monetary policy makers, after six years of highly unconventional policies meant to synthesize demand by goosing the financial system, have emptied their bag of stimulative tricks.
Again, we think the Fed will do whatever it takes to strengthen the dollar, including maintaining its normalization process if necessary, so that the US could import global wealth and capital amid a global economic slowdown.
Gold Redux?
Five years ago I wrote a comprehensive report with Lee Quaintance called Apropos of Everything, which sought to make sense of the global monetary system in an environment of excessive and increasing systemic leverage. The long report argued quite radically that the current global monetary system would ultimately fail (all have historically) under the weight of unsustainable leverage, and would likely be replaced by a system with a fixed exchange rate, probably using gold as its anchor. It is impossible to know now whether we were wrong or just very early.
My suspicion then was that before such an event could occur, the US dollar would likely gain significant strength against all major currencies. My rationale was that, unlike any time in history, there are no competing currencies with a value fixed to anything scarce. All currencies are created in fractionally reserved banking systems overseen and protected by each economy’s political dimension, which, in turn, always has incentive to choose short-term fixes over more rational long-term economic options.
In today’s monetary regime, the US has the strongest and best reserved banking system of any major currency (thanks to past QE), and the depth, breadth, fairness and oversight of its capital markets are without peer. This implies that were a global de-leveraging to occur, global wealth and capital denominated in other major currencies would be exchanged en masse for the world’s major reserve currency – King Dollar. Its unrivaled hegemony would gain stature among all fiat currencies in a global economic downturn.
To date in 2016, default-free treasury yields have dropped significantly. Whether this is due to the perception of a slowing US economy and falling inflation or the result of capital flight from abroad – or both – is unclear.
If the global economy has indeed reached crunch time, as we suspect, then we would expect the spot price of gold to move higher, and it has. Gold has been the best performing asset in 2016, rising almost 9% through last night.
Conventional wisdom argues that Treasury bonds and gold should move in opposite directions: bond prices should rise and gold prices should fall in a disinflationary or deflationary environment, and gold prices should rise and bond prices should fall in an inflationary environment. This understanding is incomplete in a very meaningful way. History shows that gold prices rise during periods of price deflation when its driver is systemic balance sheet de-leveraging.
Applied to today, if elevated leverage levels across global government, household and corporate balance sheets begin to overwhelm and crowd-out production and animal spirits, then consumer demand and the prices of goods and services should begin to decline.
One of the first places we would theoretically see struggling output is in natural resources because their production and consumption are directly impacted by economic activity. Consumer commodity prices are tougher for credit policy makers to manage because consumers do not borrow to buy a gallon of gas or a loaf of bread.
Obviously, we have seen commodity price deflation and negative sovereign yields begin to take root across the world over the past two years. Our reading of the evidence suggests that the commercial marketplace and capital markets are experiencing and anticipating global deflation from de-leveraging.
Finally, the political dimension is beginning to react to the loss of its economic power, as one would think it would have to in a global economy characterized by excessive leverage. How else might one explain the popularity of “extreme” presidential candidates on the right and left in the US? What was political radicalism a few years ago has become popular reality today. The masses in the world’s largest and most sophisticated economy are revolting against the political center. The implication is obvious: the status quo no longer serves the people.
We are pleased with the way our long Treasury and long gold positions have fared in our model portfolios so far this year, offsetting our long equity positions. We are considering whether to use some of our significant cash positions to add to these positions.
It seems monetary policy is exhausted and financial de-leveraging and austerity are naturally being imposed on economies. We should expect continued debt deflation, asset weakness and output contraction. The next exogenous lever to pull would be political fiscal initiatives. If/when they fail to stimulate demand, there would be only one avenue left – currency devaluation. If/when confidence in the mightiest fiat currency wanes, we would expect the US dollar to be devalued too – not against other fiat currencies, but against a relatively scarce Fed asset.


Digest powered by RSS Digest
 Saving...
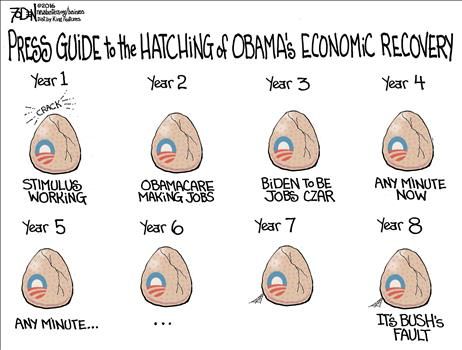