
- The Exquisite Market Setup, 23 Aug
There is an exquisite setup building once again. Tight fundamentals in the gold market apply upwards pressure on the price. For quite a while, we have been saying gold’s fundamental price was around a hundred bucks above the market price. Well, the market price moved up $46 this week. What happened to the fundamental price? You’ll have to read on to see (no cheating and reading ahead!) but suffice to say it’s quite a bit higher than the market.
At the same time, the fundamental price of silver is below the market price. We included a graph last week, showing that gold is being sold at a discount and silver at a premium to their fundamental prices. The price of silver moved up this week, though it didn’t move like gold. It was up, then down, then up, then back down, ending a mere nine cents higher than last week. In fact, on Friday, the price of gold went up about 0.8% but the price of silver dropped 1.7%.
And this is the crux. According to popular belief, the prices of the metals are supposed to move together. Silver is supposed to go up when gold goes up, only more. This is due to money printing, inflation, economic fear, anticipation of further policy madness from the Fed, or whatever. It’s much clearer when you price everything in gold.
The fundamentals for silver just aren’t there right now. What happens when a trading thesis is believed by just about everyone?
These are the market upsets about which stories are told years later.
Could we see gold with a 13 handle and silver with a 14 handle? Read on…
First, here is the graph of the metals’ prices.
The Prices of Gold and Silver

We are interested in the changing equilibrium created when some market participants are accumulating hoards and others are dishoarding. Of course, what makes it exciting is that speculators can (temporarily) exaggerate or fight against the trend. The speculators are often acting on rumors, technical analysis, or partial data about flows into or out of one corner of the market. That kind of information can’t tell them whether the globe, on net, is hoarding or dishoarding.
One could point out that gold does not, on net, go into or out of anything. Yes, that is true. But it can come out of hoards and into carry trades. That is what we study. The gold basis tells us about this dynamic.
Conventional techniques for analyzing supply and demand are inapplicable to gold and silver, because the monetary metals have such high inventories. In normal commodities, inventories divided by annual production (stocks to flows) can be measured in months. The world just does not keep much inventory in wheat or oil.
With gold and silver, stocks to flows is measured in decades. Every ounce of those massive stockpiles is potential supply. Everyone on the planet is potential demand. At the right price, and under the right conditions. Looking at incremental changes in mine output or electronic manufacturing is not helpful to predict the future prices of the metals. For an introduction and guide to our concepts and theory, click here.
Next, this is a graph of the gold price measured in silver, otherwise known as the gold to silver ratio. The ratio moved up sharply this week.
The Ratio of the Gold Price to the Silver Price

For each metal, we will look at a graph of the basis and cobasis overlaid with the price of the dollar in terms of the respective metal. It will make it easier to provide brief commentary. The dollar will be represented in green, the basis in blue and cobasis in red.
Here is the gold graph.
The Gold Basis and Cobasis and the Dollar Price

The price of the dollar dropped considerably, from 27.9mg to 26.8mg gold (i.e. the price of gold rose). However, the cobasis didn’t drop much and the basis (i.e. abundance) actually fell a bit.
The fundamental price moved up almost as much as the market price, and it’s still about a hundred bucks above the market.
There are two interesting points worth noting here. One, if this rising price of gold gets traders excited, there’s no reason why the market price couldn’t overshoot. Second, the rising price could motivate stackers to go out and buy before the price goes even higher. In other words, the fundamental could rise as well, in a positive feedback loops.
We make no prediction of $1,300+ gold. We are interested in valuing the metal, not timing the market. However, as market observers we see $1,300 as quite possible without much of a stretch.
Now let’s look at silver.
The Silver Basis and Cobasis and the Dollar Price

The price of silver went up. However, the cobasis (i.e. scarcity) is much lower than in gold—negative—and it fell.
We calculate a fundamental price of silver more than 50 cents below the market price.
Next week, we will talk about how we calculate fundamental prices and how they differ from the market price.
Monetary Metals will be in New York City on Friday afternoon, September 11. You are cordially invited to join us for a discussion of economics and markets, with a focus on how to approach saving, investing, and speculating. Midtown. RSVP here.
© 2015 Monetary Metals

- "Black Monday" – Shanghai Composite Goes Red For The Year, Wiping Out 60% In Gains, 2000 Stocks Limit Down
Black Monday! #ChinaStocks join global panic selloff, dive 8.5%, worst since Asian financial crisis at midday pic.twitter.com/nLHoFf34bV
— China Xinhua News (@XHNews) August 24, 2015
FACTS: By midday break, nearly 2000 stocks down 10% daily limit in Chinese market — only 13 stocks up; Shanghai benchmark index down 8.45%
— George Chen (@george_chen) August 24, 2015
But… but… pension funds are “allowed” to buy stocks.
Judging by the first few minutes of trading in the first thing to open this evening on the mainland, the CSI 300 Index Futures which immediately tumbled by 4% to 3340, China’s attempt to deflect attention from the fact that it did not do a 50-100 bps RRR cut is not doing too well.

Some other indicative levels which are in line with the CSI:
- Shanghai Composite to open -3.8%, some 130 points below the 3,500 “hard line” support level below which it is a nothing but air back to 2000
- Shenzhen down 4.3%
- ChiNext down 5.1%
That said, we expect the National Team to not give up without a big fight, and forcefully step in any minute and do everything in its power to prevent the resultant plunge in the Shanghai Composite which is set to open shortly, or else SHCOMP 2000 beckons, and with it lots and lots of social unrest.
* * *
Update: Shanghai Composite now down -5.7%

And the 3,500 support is now gone.

Update 2: Shanghai Composite crashing, now down 7%

Update 3 and final: SHANGHAI COMPOSITE INDEX ERASES YEAR’S GAINS


- US Equity Futures Are Crashing
Moments ago, without any specific catalyst, US equity futures just plunged when in thin, illiquid tape, a seller took out about 30 consecutive bid levels and as of last check, the ES was down as much as -48 to just 1923, or 2.5%, after being down a modest -13 minutes ago.
It is unclear just what is going on, or whether some prop desk or hedge fund just got tapped out, and/or how the Fed will react but the last time we had action like this, the Fed confused a liquidating SocGen trader for an economic collapse, and cut rates by 75 bps in January of 2008. This time it does not have that luxury.

So while we await the Fed’s response we watch in stunned amazement at a meltdown the likes of which we have not seen in years. Alternatively, if the Fed has nothing up its sleeve, the good news is that limit down for ES is just about 1870, so only 60 points more.
* * *
Update: just when it seemed that a BTFDer had emerged, even more focused selling took ES to new lows, and as of moments ago ES was down as low as 1913, down a whopping 58 points, and officially in 10% correction territory. Also, we are now down to about 50 points from limit down.


- 10Y Slides Back Under 2%, Precisely What Goldman Said Could Not Happen
Remember trade #2 from Goldman’s list of top trade recommendations for 2015?

Um, yeah…. well, moments ago the 10Y just dropped below 2% for the first time since April.

End result: tomorrow, Goldman’s cafeteria will once again be proudly serving Kermit flambe.

- SocGen: "Markets Have Lost Faith In Monetary Policies"
Aside from a few skeptical strategists, SocGen’s economists such as Michala Marcussen, have been ever so happy to drink the Kool-Aid of a US, and global, recovery that never comes and of a rate hike which until a few weeks ago was “imminent”… and suddenly isn’t even though nothing in the US economy has supposedly deteriorated. Which is why we were very surprised to read a note from none other than Marcussen, in which the formerly hopiumy economist , confirms what we have always known: that sooner or later, everyone will admit the truth.
From SocGen
Less confidence in central bank puts
As noted above, the most notable feature of recent market price action is that there has been no visible comfort taken on risky assets from the idea that central banks may step in with further liquidity injections to alleviate the situation. To our minds, this reflects two main points. First, the fact that the tremendous amounts of liquidity injected to date have produced less than spectacular economic results. Clearly, markets have lost faith in the ability of unorthodox monetary policies to kick start the economy over time. This also fits the findings of academic literature suggestion diminishing returns from subsequent rounds of QE. Second, central banks have clearly become more concerned about the potential risks to financial stability from indefinitely inflating asset prices, suggesting that they may be slower to step in.
Should the current situation – contrary to our expectations – spill over to a full blown crisis, we have little doubt that central banks would act. The lesson from the last crisis was that as the crisis deepened, central banks became more unorthodox in their approach. While part of the debt service costs of the public sector have been monetised (as central banks hand back profits from the carry of government bonds to the government coffers), actual debt has not been monetised. Moreover, political constraints have kept fiscal policy considerations in check in the bulk of the major economies. This raises an interesting question on whether fiscal policy expansion, backed by central banks, becomes the tool to fight the next crisis.
* * *
So… central bank intervention does little (or nothing, as the St. Louis Fed admitted as well), and yet SocGen has “little doubt that central banks would act.”
Come to think of it, so do we, because while the world knows Einstein’s definition of insanity, here is what his definition of idiot would be: a central banker.
As such, perhaps it is worth reminding readers that from the very beginning of this website, we predicted that the unleashing of QE, first in the US, and then everywhere else – the biggest policy mistake ever conducted by central bankers everywhere – has just one very logical ending: helicopter paradrops.


- Angry Chinese Investors Capture Head Of Metals Exchange In Predawn Hotel Raid
Meet Shan Jiuliang.

He’s the head of Fanya Metals Exchange and he was captured in a daring predawn raid in Shanghai on Saturday.

As FT notes, “Fanya is a forum for trading minor metals like indium and bismuth that has also functioned as a shadow banking conduit — not only leveraging metal deposited with the exchange as collateral for loans, but offering high interest investment products to retail investors.”
If that sounds familiar to you, it should. Just last week in “The 8 Trillion Black Swan: Is China’s Shadow Banking System About To Collapse?,” we took a fresh look at the dizzying array of wealth management products and collective trust products that are, together, a CNY17.2 trillion industry in China. Summarizing a (very) long and convoluted story, WMPs are marketed to investors through banks as a high yielding alternative to savings deposits. Investors aren’t often aware of exactly what they’re investing in or how risky it might be or that in many cases, issuers borrow short to lend long resulting in a perpetual case of maturity mismatch.
“A key issue is whether the presumption of implicit guarantees is upheld or the authorities allow failing WMPs to default and investors to experience losses arising from these products,” the RBA said in a report, to which we responded that in the event investors are forced to take losses, “the key issue is what those investors will do next.”
Well, now we know.
First they will stage angry protests and then, if their money is not returned to them in about a month, they will travel from all corners of the country, stake out a hotel, kidnap the issuer of the WMP and haul him away to jail. Here’s FT with the story:
The head of a Chinese exchange that trades minor metals was captured by angry investors in a dawn raid and turned over to Shanghai police, as the investors attempted to force the authorities to investigate why their funds have been frozen.
Investors have been protesting for weeks after the Fanya Metals Exchange in July ceased making payments on financial investment products. The exchange, based in the southwestern city of Kunming, bought and stockpiled minor metals such as indium and bismuth, while also offering high interest, highly-liquid investment products from its offices in Shanghai and its financing branch in Kunming.
Some investors flew in from faraway cities to join hundreds more surrounding a luxury hotel in Shanghai before dawn on Saturday. When Fanya founder Shan Jiuliang attempted to check out, they manhandled him into a car before delivering him to the nearest police station. Shanghai police took Mr Shan into custody and promised to work with local authorities in Yunnan province to investigate what has happened to investors’ money. They later released him without charge.
The demonstrations in Shanghai and Kunming and the exchange’s unusual accumulation of several years’ supply of some metals have so far failed to attract much public attention from regulators. A report by the local regulator identifying the exchange as one of the bigger investment risks in Yunnan was redacted to remove reference to Fanya late last year.
The exchange began to experience liquidity problems this spring. Fanya is estimated to hold several years’ supply of minor metals used in some high-tech and military applications, which it purchased at above-market prices. The exchange’s travails are pressuring prices for some of these metals, as traders anticipate it will have to sell its stockpile.
The exchange, which has acknowledged it has problems, is backed by several of China’s minor metals miners. It has said it has found a buyer but won’t identify the company. Mr Shan “was deceiving us. He admitted to us that there is no buyout group,” said one disgruntled investor surnamed Gu, who participated in the rainy early morning raid.
Mr Shan has been holding regular meetings with exchange backers since problems first surfaced this spring and was on the way to Guangzhou for a business trip when captured.
As you can see, we are not at all joking when we contend that any move by China to allow for defaults and permit market forces to play a larger role in determining which investments eventually sour is likely to be met with a severe public backlash, especially for something like WMPs where investors believe they may have been deceived.
If Shan Jiuliang’s bad weekend is any indication of what’s in store for the Politburo once the PBoC loses complete control of the stock market, managing the yuan and restoring economic growth may be the least of Xi Jinping’s worries.


- Bloomberg's Commodity Index Just Hit A 21st Century Low
After the Bloomberg commodity index crashed overnight, having tumbled for each of the past 4 years, this happened:
- BLOOMBERG COMMODITY INDEX SLIDES TO LOWEST LEVEL SINCE 1999
Said otherwise, the lowest level in the 21s centiry.

Yup, rate hike any minute now.

- They're Gonna Need A Bigger Balance Sheet
Submitted by Jim Quinn via The Burning Platform blog,
Driving home from work on Friday night I found it terribly amusing listening to the “business journalists” on the local news station trying to explain the 531 point plunge in the Dow and the 1,105 point plummet from the Tuesday high. The job of these faux journalist mouthpieces for the status quo is not to report the facts, analyze the true factors underlying the market, or seek the truth. Their job is to calm the masses, keep them sedated, and paint the rosiest picture possible.
The brainless twit who reported the stock market bloodbath immediately went into the mode of counteracting the impact of what was happening. She said the market is overreacting, as the country has strong job growth, low inflation, a strongly recovering housing market, and an improving economy. The fact that everything she said was a complete and utter falsehood was exacerbated by her willful ignorance of the Fed created bubble leading to the most overvalued stock market in history. How can these people pretend to be business journalists when they haven’t got a clue about stock market valuations and just say what they are told to say?
Anyone who listens to a mainstream media pundit, talking head, or spokes bimbo deserves the reaming they are going to receive. They are paid to lie, obfuscate, spin, and propagandize on behalf of their corporate media executives, who are beholden to Wall Street bankers, mega-corporations, and the government for their advertising dollars. The mainstream media is nothing but entertainment for the masses, part of the bread and circuses designed to distract the dumbed down, iGadget addicted, ignorant masses.
The entire stock market bubble has been created and sustained by the Federal Reserve and their QE and ZIRP schemes to prop up insolvent Wall Street banks, enrich corporate executives, and produce the appearance of a recovering economy. The wealth was supposed to trickle down to the masses, but the trickle has been yellow in appearance and substance. The average American is far worse off today than they were in 2007, with the Greater Depression Part 2 underway.
The Fed balance sheet currently stands at $4.5 trillion. Seven years ago this week it stood at $931 billion. Seven years before that it stood at $641 billion. From August 2001 through August 2008 the Fed grew their balance sheet by 45%. This period encompassed a recession, dot.com implosion, and a housing crash. Since 2008 the Fed felt it necessary to increase their balance sheet by 383% even though we have supposedly been in an economic recovery for over six years, with unemployment back to 2007 levels, corporate profits at record highs, and everything back to normal if you listen to the mainstream media.
Someone needs to explain the correlation between the Fed balance sheet and the S&P 500 to the bubble headed spokes models on CNBC, Fox, CNN, and MSNBC. The economic recovery is nothing but a debt saturated fraud, propped up by subprime auto loans, 7 year 0% auto financing schemes, enslaving young people in student loan debt that will never be repaid, pretending unemployed people aren’t unemployed, under-reporting inflation to suppress wages and inflate GDP, and artificially inflating stock, real estate, and bond markets with negative real interest rates.
Anyone who doubts the sole purpose of QE1, QE2, and QE3 was to boost the stock market and create the glorious “wealth affect”, is either blind, dumb or a direct beneficiary of the scheme. When the S&P 500 bottomed at 666 in March 2009, the Fed balance sheet stood at $1.9 trillion. In June of that year, the official end of the recession, the Fed balance sheet stood at $2.1 trillion. If the recession was over in June 2009, why would the Fed possibly need to more than double their balance sheet over the next five years? If the crisis had passed, as we’ve been told by the mainstream media, politicians, and central bank academics, what possible reason would the Fed have for pumping heroine into the veins of the criminal Wall Street cabal?
The reason is quite simple. The Fed is owned and controlled by Wall Street. Do you need any more proof than knowing Helicopter Ben makes more ($300,000) from a sixty minute lunchtime speech at a Bank of America banker bacchanal than he made per year as Federal Reserve Chairman. The chart below provides the remaining proof. From the March low of 666, the S&P 500 went up by 200%, to over 2,000 when the Fed reluctantly ended QE3 on October 29, 2014. Do you think it was just a coincidence the Fed balance sheet also expanded by 200% since QE started in late 2008?

The mouthpieces for the oligarchy have contended this was all just a coincidence. They have been told to spread propaganda about fundamentals, economic recovery, job growth, and rising earnings per share. Is it also a coincidence the S&P 500 is exactly where it was on September 30, 2014 as the Fed stopped pumping heroine into the arms of Wall Street traders? The market went up 200% in five years, in virtual lockstep with the Fed balance sheet. The Fed balance sheet has been virtually flat for the last year and the S&P 500 is virtually flat in the last year. No correlation there. The mainstream media needs to distract you from seeing the truth. Look over there at Caitlyn Jenner. How about that Trump. Black Lives Matter. Time for fantasy football. Whatever you do, don’t look behind the curtain and realize the people running the Federal Reserve are corrupt, captured, and clueless on what to do next.

The Great and Powerful Fed has had the curtain pulled back to reveal a doddering old lady and a gaggle of flying monkey academics attempting to bluster their way out of the box they have created for themselves at the behest of their Wall Street owners. The global economy is in free fall and the Fed talking heads are still speechifying about a lousy .25% increase in the Fed Funds rate, as if it means anything to anyone in the real world of paying bills, going to work, buying groceries, and living life. Do these pompous pricks actually think a minuscule increase in an obscure interest rate will impact the average household whose real income is lower than it was in 1989? The gall of these academic pinheads is breathtaking to behold.
The only thing propping up our stock market over the last year has been the insane lemming like behavior of corporate CEOs across the land, borrowing at record low rates thanks to the Fed, and using the proceeds to buy back $2.3 billion of their own stock in order to “enhance shareholder value” and of course enrich themselves through their stock incentive compensation plans. Our market had also been seen as a safe haven by Chinese billionaires and rich Europeans seeking shelter from the storms sweeping across their continents. Last week’s stock market implosion will scare the CEO lemmings into halting their buybacks as they calculate the amount of value destruction they inflicted on shareholders, while the interest on the debt keeps rising.
You can be sure the discussions among the elite members of the Deep State – Fed central bankers, foreign central bankers, the heads of the biggest Wall Street banks, Treasury Department apparatchiks, Washington politicians, heads of the corporate media outlets, influential corporate CEOs, and powerful billionaires – are happening this weekend in an effort to keep their debt based ponzi scheme going. They know only one solution – print more money (QE4), increase government debt levels, fake the economic data, and utilize their propaganda outlets to calm the masses with more lies.
Can these desperate measures work again? Maybe temporarily, but their impact lessens each time they roll them out. They will never voluntarily abandon the addiction to credit expansion because it is the only thing sustaining the wealth of the Deep State. These sociopath arrogant egotists would rather destroy the world financial system than admit they were wrong. Ludwig von Mises explained what will happen many decades ago.
“There is no means of avoiding the final collapse of a boom brought about by credit expansion. The alternative is only whether the crisis should come sooner as the result of voluntary abandonment of further credit expansion, or later as a final and total catastrophe of the currency system involved.” – Ludwig von Mises

- This Advice Has Cost Investors a Sh*tload of Money
Perhaps, like me, you’ve been hearing “the dollar is going to die” rhetoric nonstop for the last few years.
Our stance, well documented in these pages here, here, here and here, amongst many, many other posts, has been that for the last 12 months we’ve been long, and remain long – very, very long!
Last week I woke to 3 articles forwarded to me by some friends. I don’t typically pay any attention to these particular investment writers, as I categorize them in the “marketers,” not “professionals” basket.
The reason they were forwarded to me was to point out the duplicity. All three have been in the “dollar’s going to Hell” basket, and equally interesting, literally overnight all three have begun the spin process of changing their tune! The “unexpected” PBOC devaluation of the renminbi has been the catalyst.
Politicians could actually learn a few tricks from these guys! Here are a couple of the rules of their playbook:
Rule number 1: Never admit to being 100% wrong, and;
Rule number 2: Ensure you spin any market event to appear as if, “Why yes, of course we knew all along that the RMB was going to devalue.”
Quite frankly, the articles my friends forwarded me are a pig to read. They are filled with emotionally laden sound bytes, arrogance, inaccuracies, and logic which, like a cardboard cutout, simply goes soggy in the rain. It gives me a headache, and as I read through them, I found myself yelling obscenities at my computer.
It’s commendable in a morbid, psychologically imbalanced sort of way. A few simple Google searches reveal the deception, but no matter, press on we must, and revel in the fact that the vast majority of sheep will never do any meaningful due diligence.
When I see that sort of duplicity, then all credibility disappears for me. We have to be able to acknowledge our mistakes otherwise we’re bound to repeat them.
We’ve gotten things wrong before and we’ll certainly get them wrong again, but I always encourage a debate on the topics. Nothing can be more valuable than a rigorous debate in order to flesh out and better understand. After all, what if I’m wrong?
I have no particular ilk with any of these “investment experts,” aka “newsletter writers.” As a keen observer of market psychology and history I view them simply as another cog in the zeitgeist wheel which I find fascinating. Wolves will be wolves and sheep will be sheep.
Along the same lines, another tale that’s been as popular as a Kim Kardashian nipple slip video, has been this idea that investors should be long the RMB because really, no really, it’s going to replace the dollar soon, and possibly even while you sleep this evening. Yep, it’s gonna happen that fast. Never mind it’d be the first reserve currency in the history of the world to disappear overnight (and there are sound reasons why this is the case), but let’s not let rigorous analysis get in the way of sensationalism.
Before you send me any emails about the insolvency of the US government let me stop you right there. Yes, the US government is bankrupt (I know that “technically” that isn’t possible, but you get my drift). Yes, they have a pension nightmare and yes, the country is a police state. But, looking at the world in isolation, together with an oft agenda-driven myopic view, needs to be seen for what it is – marketing – nothing more and nothing less. No different to that “must have” shampoo that miraculously gets you a gorgeous, loving, nymphomaniac girlfriend.
Why?
I never fully understood why people would write such rubbish, and how they get away with it. It wasn’t until just the other day, during a conversation with a friend, that it all made perfect sense to me.
My friend, who I’ll leave anonymous so as to not get him into any trouble, is a true “professional investor” who authors an investment newsletter (or two). His niche is value investing, and year after year he’s soundly beaten the market. All he focuses on is finding great companies that have a high probability of success and capital appreciation. Novel idea.
Our discussion ran to the publishing business, and this is when it all made sense to me. Publishing houses test “copy,” and when they find “copy” that works well, they devise a product around it and sell it. Boom!
I remarked how bass-ackward this really is. Marketing hype sans rigorous intellectual and analytical thought. No matter… if the narrative works marketers push it and push it big.
My friend’s particular newsletter is less financially successful than many of its competitors, even though, like clockwork, it beats them all hands down on a pure return basis.
Shortly after this conversation I spoke with a long time reader who has become a friend. We discussed a purchase of land in Chile which he made some time ago. I pointed out that he’s lost over 50% on his investment in dollar terms since 2011, and over 40% since 2013. It wasn’t something he’d thought about, and thankfully he is un-leveraged.
To break even on this investment he now needs 100% appreciation. Think about that for a moment. What’s more is I think the Chilean peso goes even lower. In fact, it’s just broken a long-term trend line (as have some other LatAm currencies, including the Colombian Peso), and this is where we get big acceleration phases. We think you have to be short. We may be wrong, and of course we have been in the past. Our thinking, if interested, is laid out in our report entitled: USD Bull Report.
 Chilean peso
My friend (now a bit more depressed than he was before our call) and I discussed what likely lies in store. He was (falsely?) comforted by the idea that this is temporary, a short-term setback for the Chilean economy and currency. I think this is a huge risk. Failing to understand why the USD is rallying in the first place means that the odds of understanding why and when it will end are vanishingly thin.
Part of the disconnect lies in failing to understand global capital flows, why the USD is rallying, and why on the balance of probability we’re still at the beginning of this run, not near the end.
Back to China and the RMB
I’ve heard the argument that China can sell their USD holdings to defend the RMB. Even if that were the case this fails to take into account the entire picture. There are many reasons for China to devalue, not the least of which is that it’s politically palatable. They are still an export driven economy who have seen their currency rise substantially against their competitors such as Japan.
Trying to quantify their FX reserves as a % of GDP is nuts. Their numbers are bollocks and can’t be trusted. Mark Hart has a more meaningful measure of reserve adequacy. This is FX reserves divided my M2.
2/ the best measure of reserve adequacy is fx reserves/m2. China’s is 17%: $3.69T/$21.49T. Pre 97 crisis Asian tigers averaged apprx 28%
— Mark Hart (@MarkHar13514700) August 11, 2015
This means that with a meaningful capital flight China will NOT have sufficient reserves to defend its currency.
The USD will be strong NOT because it’s the reserve currency, that has always been the case, but it’s NOT the answer now. The USD will be strong principally due to an unwinding of the carry trade. If you don’t understand this you’ll be lost.
If you have to pay back a loan to an individual who is insolvent it doesn’t matter a damn. You still have to pay that money back. That the US Government is insolvent is IRRELEVANT right now.
The low hanging fruit then?
 Turkish lira
Poster child of external debt.

South African rand
Both of these two currencies are at major long term resistance levels. If they break from here it’s waterfall time.

Colombian peso

Korean won
Bottom line? Don’t go walking into an investment without understanding its context.
When someone (newsletter writer or other “professional”) has a vested interest in telling you something, make sure you understand their bias and their agenda. One day, when I’m involved in a fund or funds (soon), please be sure to question me on my bias and my agenda. You’ll get the truth.
Until then (soon) I have no stake in the fight, other than to make money by being positioned correctly.
– Chris
“Fortunately for serious minds, a bias recognized is a bias sterilized.” – Benjamin Haydon

- Crude Snaps Below $40 : Gartman Stopped Out Of Oil Long
It was inevitable.
As we reported first on Friday, the best contrarian indicator the market has ever known, perhaps even better than the legendary FX titan, Tom Stolper, Dennis Gartman recommended clients invest their monopoly money alongside his, in a short gold, long crude trade: one which has lost about 5%on both legs in 24 hours. To wit:
CRUDE OIL PRICES ARE LOWER BUT WE ARE CHANGING OUR VIEW ON PRICES for having been overtly and rather relentlessly… and very publically… bearish, we are this morning turning bullish of crude oil and we are turning so because the term structure shifts mandate that we do so…. We do not make this statement lightly for this is a material shift in our view of the energy market… a very material shift.
* * *
Amidst the carnage of the global stock markets this morning and even in light of the sustained bear market in crude oil, the narrowing of the contangos in Brent and WTI brings us to become a buyer of crude as noted at length above. We’ll buy a unit of crude oil, split between Brent and WTI, upon receipt of this commentary. We shall, for the moment, give these prices the latitude to move 3% against us, hoping that we can tighten that up when we return Monday.
Moments ago, the $40 support level for oil finally snapped…

… and with its so did Gartman’s oil stop loss level, which means Gartman is now stopped out.
Normally this would mean going long, however in this case China has yet to open and following the disappointment of no RRR-cut, tonight’s commodity carnage may just be beginning.

- "Long, Slow, And Painful": Barclays Documents The End Of The Commodities Supercycle
Emerging markets will remain in focus this week as the world watches anxiously to see if China’s move to devalue the yuan will ultimately transform an already precarious situation into an outright crisis.
Slowing demand from China has been the major concern for commodity exporters and indeed, wide open capital markets (thanks to ultra accommodative monetary policies across the globe) have served to keep struggling producers afloat, perpetuating a global deflationary supply glut.
Saudi Arabia’s attempt to squeeze the US shale complex has only exacerbated the problem, as persistently low crude prices put further pressure on the commodities space as well as on the FX reserves of oil producing countries. When China devalued the yuan, it validated the suspicions of those who had assumed that the country’s economy was in far worse shape than anyone at the NBS was willing to admit. Additionally, it marked a new escalation in the global currency wars and threatens to undermine the export competitiveness of many an emerging economy.
Now, markets are in turmoil and the dramatic plunge in EM currencies threatens to upend markets the world over on the way to ushering in a new financial crisis.

If we have indeed entered a “new era” – to quote Kazakh Prime Minister Karim Massimov – for crude and for commodity prices more generally, it could have widespread implications for everything from oil producers’ FX regimes to demand for USD assets. As Goldman noted earlier this year, “the new (lower) oil price equilibrium will reduce the supply of petrodollars by up to US$24 bn per month in the coming years, corresponding to around US$860 bn over the next three years.” That could portend a meaningful loss of liquidity across some asset classes.
It’s against this backdrop that we bring you the following commentary from Barclays on the outlook for commodities in the new era.
* * *
From Barclays
“Long, slow, and painful (probably with more to come..)”
It is an old saying in commodities that the best cure for low prices is low prices. Market participants are now asking how much further prices need to fall and how long they need to stay there to bring supply and demand back in to balance and halt the price declines across a broad swathe of different raw materials markets. The fear is that just as the upside of the supercycle brought an unprecedented and long period of historical price highs, the plunge to the downside is shaping up to be equally dramatic and may yet have a way to run. In terms of depth, length and breadth, this is already a much more severe commodity price downturn than any the market has experienced in recent history. The 15% decline in the broad-based Bloomberg Commodity Index since May means prices are on average about a third lower than they were a year ago, only half what they were when the initial recovery from the financial crisis peaked in March 2011 and only a third of the all-time highs for the index hit in 2008. Almost all the gains associated with the so-called “commodity supercycle” have been eroded, and the index is back at levels not seen since 2002.

There are three key structural factors that are reinforcing the long-term downtrend in commodity prices. The bad news for producers is that it is difficult to see any of them easing in the short term.
Broken China
First is the slowdown in China and a shift in its economic growth model leading to a big reduction in overall commodity demand growth rates. Over the past five years, Chinese demand for oil, copper and aluminium has risen on average by about 6%, 9% and 13%, respectively, each year. We forecast those growth rates will slow to 3%, 2.4% and 2.5%, respectively, for the next five years, and the transition to those much slower growth rates is under way (see Figure 3).
Last week’s China devaluation spooked commodities markets because it underlined just how difficult it is for China’s policymakers to manage such a large-scale transition. However, it will do little to improve the competitiveness of China’s manufacturing sector, and although there are hopes that infrastructure spending is about to pick up a little, the massive indebtedness of China’s local governments mean any improvement is likely to be quite modest compared with previous stimulus programs.
Just too much
The second factor is the fact that many important commodity markets remain hugely oversupplied and the producer adjustment process still has a long way to run. In every commodity price downcycle, commodity producers tend to hang on for as long as they can even when margins are cash-negative, in the hope that others will close first. However, this time oversupply is being made a lot worse by fierce competition for market share. This is most evident in the oil market where OPEC countries have made market share gains a specific aim and the group has raised its production by more than 1m b/d so far this year. While its high level of output may be difficult to sustain due to threats in some OPEC countries such as Iraq, there is little sign yet of any marked OPEC declines.

Our third and final structurally bearish factor for commodities is the long-term upward trend in the value of the dollar, which, in our view, still has some way to run. This is putting downward pressure on producer cost curves and ensuring even lower prices are required to bring about cuts to output, while at the same time raising prices in non-dollar currencies and, thus, reducing price-sensitive demand.
Figure 4 shows how the decline in commodity prices has become intertwined with the falling currencies of major producers. These two trends are tending to reinforce each other. Commodity prices fall, leading to reduced growth prospects in commodity-producing countries such as Brazil, Australia or South Africa. That puts downward pressure on local currencies, which reduces producer operating costs in those countries and means that even lower prices are needed to force them to cut back. In this way the vicious circle continues.
While it may come as welcome relief to some, the last thing the commodities markets need right now is a short-lived price recovery. There is little doubt that the Q2 rally in oil prices – by enabling producers to lock in decent margins by selling forward and encouraging some US tight oil producers to start drilling again – has lengthened the downside for oil prices by prolonging the supply-side adjustment process. A repeat of that process will just prolong the pain even more.

- "Savage Speed" – A Look Inside Market Crash Statistics
Submitted by Salil Mehta via Statistical Ideas blog,
It was surely a frightening week in global financial markets. The largest 500 American stocks (S&P) dropped 6%. China's Shanghai Stock Exchange (SSE) doubled this risk, as it dropped 12%. Now there is an overall fear in the markets that we have not seen in years. While these perilous risk statistics should not be something new, the surprising jolt this week provides a renewed opportunity to review crash measures within a broader context, to boldly target your portfolio.
Let's look at the worst weekly loss for the S&P, in each month from 2007 through August 14 (or right up until last week). Geometrically approximated for symmetry. We see in blue that the distribution of this monthly "worst weekly loss" has generally been similar to the same ranked values from the past couple of years (2103/2014). Now towards the bottom of the chart we can better ascertain that the more severe "worst weekly losses", were even worse in the years earlier than this (so 2007 through 2012).
We'll prove out these numerical measurements here, but if you are dispassionate about the mathematics then don't fear. Please just skim what is immediately below -and head straight to the first illustration afterwards- to continue reading. In October 2008, the worst weekly risk was -20% (this makes October the 24th worst month for "worst weekly loss" of 24 months in 2007/2008). Hence it is plotted in red ~98 percentile at the bottom of the vertical axis below. Not perfectly the 100th percentile (0% rank) due to probability math. Also in the same 2007/2008 series, the next worst month for the "worst weekly loss" statistic was the following month of November. That month saw a -9% change and being 2nd worst out of 24 means being ranked about 4% higher on the vertical axis, from where the -20% data is shown:
2/24 (for second worst of 24) – 1/24 (for worst of 24)
= 1/24
~4% more favorable rankSimilarly all of the axis tick marks, for all of the complete 2-year periods shown, are ~4% apart on this inverse distribution axis (i.e., 98%, 94%, 90%, etc.) For 2015, up until this month of August there were 7 months, and the worst weekly loss of them was January's -3% change. The lowest blue data shown represents that month (and 7th worst of 7 months is ~93 percentile at the bottom of the vertical axis). To summarize, the worst ~6% of months (100%-94 percentile) in 2007/2008 was about -9% and much worse than for 20015 where it was about -3%.
Also for completeness, we see that the most favorable "worst weekly loss" among months in each of the time periods shown below (so towards the top of the chart) was essentially a non-event at ~0%. We all know that we are no longer at that tail of the distribution!

So next we identify with a black star how last week (5 days though August 21) compares with the 2015 series to date. We see that last week's -6% change for the S&P is completely out of line with the rest of 2015, and it is beyond anything we've seen since before 2013! Despite this multi-year record blasting across the news, one also can not fully state that 2015 though is a trend reversion to the risk we experienced during the global financial crisis, since the red 2007/2008 risk statistics are almost all higher than the entire blue statistics shown above.
We perform the same exercise again, but for the SSE. We see in blue again the distribution of the "worst weekly losses", and it has generally not been similar to the distribution of the previous couple years (2103/2014). But unlike with the S&P, 2015 risk statistics are instead closely aligned to the same risk measure from the global financial crisis era 2007/2008 (again, in red). And this narration stays the same, across the complete collapse risk distribution (i.e., the vertical axis).

We again show with a black star how last week compares with the prior 2015 series to date. We see that last week's -12% change for the SSE is here completely inline with the rest of 2015 (and also within range of 2007/2008)! Unlike for the U.S., last week's loss in China wasn't their 2015 worst nor 2nd worst (those even worse months were earlier this summer when the SSE begun to crash). Also, here one can fully state that 2015 (regardless of how the rest of the year turns out) is a trend reversion to the risk we experienced during the global financial crisis, since the red 2007/2008 risk statistics nicely overlap the blue 2015 statistics. Both colors are also mostly completely more severe than the entire 2009 through 2014 risk statistics shown above! We might see these articles (here, here) for idea generation on future month's SSE risk and whether it might continue to be high.
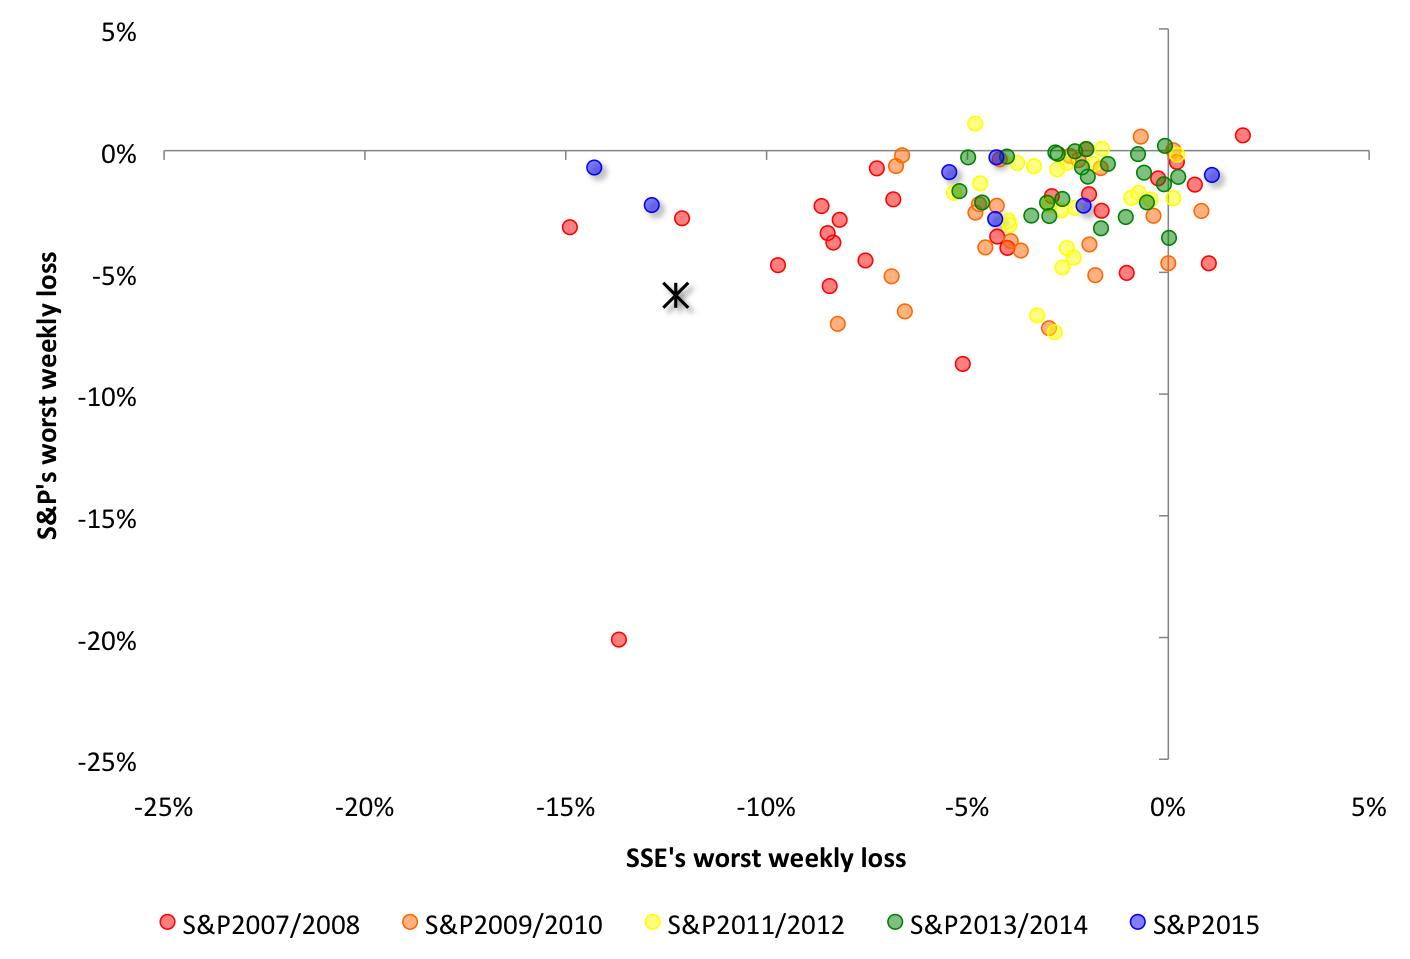
We will further accommodate those unwavering in their false position that there is a broad mathematical relationship between both of these countries' time series (and using China's proximate market burst as a pretext to interpolate back history). See the raw monthly plot below, contrasting both indexes. We see that last week's (still highlighted with a black star) joint losses for the U.S. and China are mostly a shock within the 2015 context (blue), for mostly the U.S. but not as much for China.

We see that either the correlation of individual time periods, or of all of these time periods combined (so ignoring the time series colorings), does not exist as a routine matter. With markets, there will always be one-off exceptions (see this Top Article in Pensions & Investments); our goal with this article is to simply present a framework for high-level risk analysis. The overall correlation doesn't exist, even with the one mad, worst weekly joint-loss shown for October 2008 (-20% SSE and -14% S&P). This data without context should have been considered an outlier. And the 2015-only correlation between China and the U.S. also doesn't exist, even though this year has the most probabilistic potential for it, as the variance among the SSE is extraordinarily high (this is referred to as the sum of squares in probability language). Lastly, we can collectively respect that the joint losses were more severe in 2007/2008 (red) then they are this year (blue + black star).
We are not breaking new theoretical ground in this article since that's not required. The mathematical rigor of these relationships have already been recorded in these articles, sorted by order of consequence: here, here, here, here. It is worth noting that at some point one may want to reallocate to the risky market. Clearly no one should have been 100% stocks a week ago (particularly high ? stocks). Someone was buying stocks a week ago, and many were selling in fear through yesterday (August 21). One might want to instead try that in reverse to make money (buy at a discount and sell at a premium). We should also note that the developed markets was subjected to record-setting wealth annihilation at the end of last week. It is wise to be carefully attentive now, with the given global market volatility.
We can all call attention to nervous economic data, but there are also some core measures (GDP, employment, etc.) showing the U.S. economy is not in chaos. While possible, it is not the expectation that we should expect risk statistics to be worse than the 2007/2008 measures from the global financial crisis. What makes a market is having differing opinions at nearly all times. It is therefore educational for people caught off guard last week to see –once more– that markets can drop at a savage speed (as opposed to the overall magnitude), regardless of whatever foggy economic situation we are in (or market participants believe them to be).

- Risk Appears Seriously Wounded
Submitted by Jeffrey Snider via Alhambra Investment Partners,
Stocks aren’t quite as immune to financial disruption in the middle of 2015 as they had been previously. The last major, comprehensive selloff was also in tandem with “dollar” disorder back last October 15. This time, the motion was more erosion than “event”; at least until the past week. Just like crude oil, stocks lost their momentum back in early May (and broader index price indications dating back to last July and the first “dollar” rumble) and had more or less been stuck like the yuan doing nothing until the open break recently.


What may, in the intermediate term, be much more significant is that the S&P Buyback Index has been sinking during the whole of that interim period. Whether or not that indicates less actual buyback activity is not clear, but the suggestion is more than reasonable given the buyback scheme as a separate equity liquidity junction. That it has continued since really March brings up more economic and corporate cash flow factors (another facet in the “dollar”, both as earnings and debt opportunity) in these companies than financial issues with the “markets” more broadly.

Whatever the case, for the first time since 2012, after today’s robust selling, the S&P 500 is negative on a yearly basis. The Buyback Index is likely showing the same lack of momentum, though that is an assumption as the final index value for today’s trading hasn’t been posted.


The broader NYSE Composite is down 7.2% on a yearly basis and 8.2% since last July 3 at the “dollar’s” outset.

That brings stocks back into the same discussion as the corporate credit bubble. Junk prices continue to sell down, both retail and institutional. The HYG mutual fund broke to a new low again today, down over 10% since its high back on June 25, 2014. There are clear liquidity indications in that price as well as a fundamental shift in overall risk perceptions.


The Leveraged Loan Index, as HYG, continues to drop to new multi-year lows. The last time the market value component was at 953 was January 5, 2012! As usual, since these are the most liquid 100 names in leveraged loans, it is almost certainly the best case for the class; with leveraged loan prices elsewhere likely much more dramatic.

I think we are starting to see the legend of QE fade into nothing more than memory, exposing all these “markets” to the very real dangers of the fundamental economy, globally, that never joined the hype. As noted this morning, it was perhaps a bit “easier” to ignore the first “dollar” wave as it crashed into January as though it were just a bump on the road to sufficiency, but this second crash is both more severe and constraining; not the least of which because, as it takes on new and greater proportions than the first, it demonstrates pretty conclusively all that was wrong about the suppositions that supported rationalizations for so long.
Does that mean QE5? It might, but at this point is there any illusion left? After all, this broad selloff comes just as this week market perceptions turned the FOMC supposedly “dovish” once more. In the past that would have been at least a more than one-day rally, and a sharp one, but again I think the entire focus has changed from “accommodation” even in potential to simple confirmation of the no longer abstract economic and financial danger. I have no idea if that means a top, but this market increasingly looks very, very tired if not seriously wounded.


- Futures Stumble Out Of The Gate, Slide 0.6% On Lack Of Chinese RRR Cut: What Happens Next?
On Friday, ahead of the closing stock rout, we forecast that the biggest risk for anyone staying long over the weekend was a disappointment out of China, where the sellside had gotten so excited that a 50-100bps RRR cut was imminent, that the lack of one would surely send futures sliding.
As noted earlier, everyone is expecting a 50-100 bps RRR cut this weekend. The risk is there isn’t one http://t.co/oU5t45ERWw
— zerohedge (@zerohedge) August 21, 2015
Sure enough, as we noted earlier today, much to everyone’s surprise and disappointment, the PBOC did nothing (for reasons we speculated upon earlier).
Which bring us to this evening’s S&P futures, which opened for trading minutes ago, and as expected gapped by over 0.6% after the Chinese disappointment, down 19 points to 1952 and looking quite heavy as several key support level as in the crosshairs.

The key carry driver for all US equity action, the USDJPY, is not looking too healthy either and just hit its lowest level since July 8 as the Yen is soaring on carry trade unwinds:

To be sure, the real action in tonight’s illiquid market will not be in US futures, at least not until Europe opens, but in China, where it will be up to the “National Team” to prevent a massive rout now that the PBOC has told stocks they are on their own for the time being..
Also keep an eye on crude: after an initial gap lower the black gold is trying to stabilize the drop. Perhaps it is waiting for Gartman to confirm he is still long before crashing below $40.

So what happens next? It’s clearly anyone’s guess so here courtesy of Bloomberg is a selection of quite a few guesses including some pundits, most of whom predicted smooth sailing until year end, who suddenly and very dramatically changing their tune.
- “It’s going to be pretty deep. … We’re in the camp that this is not yet a big move. It’s scary, and those last two day trends look ugly.” — Doug Ramsey, CIO at Leuthold Weeden Capital Management, who sees losses in S&P 500 reaching 20%
- “When Europe and China eclipse the U.S. we chug along, but when they’re in a down market, that’s when the U.S. really dominates. … From a quality perspective, all the boxes are checked off in the U.S. and that becomes more important to investors again.” — Savita Subramanian, equity strategist at Bank of America, who cites optimism about the biggest U.S. cos.
- “There is a relatively more ominous slowdown going on in emerging markets — and that’s what the trade is all about right now.” — Gina C. Martin Adams, equity strategist at Wells Fargo Securities, told New York Times
- “These are names that people look at — if they can run their business well, then the economy is doing well. … So when Apple misses and sells off hard, it’s bolstering that fact that we don’t have an equity market to trust.” –Larry Weiss, head of U.S. trading at Instinet in New York, speaking about the most popular U.S shares
- “People are saying, ’I want out.’ … It is difficult to see the bottom with all these depreciating currencies.” — Ricardo Adrogue, emerging-markets-debt investor at Babson Capital, told New York Times
- “People are saying ‘I told you so,’ but that warning has been in place too long—you would have had to be a superhero to know what would happen.” — Katie Stockton, chief technical strategist at BTIG, commenting on narrow leadership in the bull market to WSJ
- “Hopefully, Asian governments don’t panic from the current market turmoil and resort to knee-jerk decisions. … Competitive currency devaluations can become a zero-sum game if all countries resort to it.” — Sandy Mehta, CEO of Hong Kong-based Value Investment Principals
- “There’s no way the U.S. is going to remain an island with so much turmoil going on around the rest of the world.” — Paul Zemsky, head of multi-asset strategies at Voya Investment Management
- “If at the beginning of the year, you told anyone that theFed would be 50/50 about raising rates at their next meeting and the 10-year yield was approaching 2%, they would think you were nuts.” — Antonin Cronin, a Treasury bond trader at Société Générale, told WSJ
- “You have to talk about the Fed and the absence of any trigger-style warnings. … That’s a critical reason why everything gets interpreted as supporting the Fed’s caution, and that’s in direct contrast to the thinking we had just last week.” — Jim Vogel, head of interest-rate strategy at FTN Financial in Memphis, Tennessee
- “A nasty storm is probable, not just possible [in countries like Brazil and South Africa]. … But I do not anticipate a crisis or even very tense moments in Asia. The main reason is that the Asian Crisis of 1997 already cleansed Asia’s financial system and Asia’s resilience ought to be higher.” — Stephen Jen, co-founder of SLJ Macro Partners
Bottom line: not looking good for the BTFDers but don’t count your chickens, or dead bulls, just yet – if Gartman suddenly turns bearish, or is stopped out of his crude long in 15 more cents, a mass bear slaughter is about to be unleashed…

- The World Explained (In 2 Cartoons)
- Does Capitalism Cause Poverty?
Authored by Ricardo Hausmann, originally posted at Project Syndicate,
Capitalism gets blamed for many things nowadays: poverty, inequality, unemployment, even global warming. As Pope Francis said in a recent speech in Bolivia: “This system is by now intolerable: farm workers find it intolerable, laborers find it intolerable, communities find it intolerable, peoples find it intolerable. The earth itself – our sister, Mother Earth, as Saint Francis would say – also finds it intolerable.”
But are the problems that upset Francis the consequence of what he called “unbridled capitalism”? Or are they instead caused by capitalism’s surprising failure to do what was expected of it? Should an agenda to advance social justice be based on bridling capitalism or on eliminating the barriers that thwart its expansion?
The answer in Latin America, Africa, the Middle East, and Asia is obviously the latter. To see this, it is useful to recall how Karl Marx imagined the future.
For Marx, the historic role of capitalism was to reorganize production. Gone would be the family farms, artisan yards, and the “nation of shopkeepers,” as Napoleon is alleged to have scornfully referred to Britain. All these petty bourgeois activities would be plowed over by the equivalent of today’s Zara, Toyota, Airbus, or Walmart.
As a result, the means of production would no longer be owned by those doing the work, as on the family farm or in the craftsman’s workshop, but by “capital.” Workers would possess only their own labor, which they would be forced to exchange for a miserable wage. Nonetheless, they would be more fortunate than the “reserve army of the unemployed” – a pool of idle labor large enough to make others fear losing their job, but small enough not to waste the surplus value that could be extracted by making them work.
With all previous social classes transformed into the working class, and all means of production in the hands of an ever-dwindling group of owners of “capital,” a proletarian revolution would lead humanity to a world of perfect justice: “From each according to his ability, to each according to his needs,” as Marx famously put it.
Clearly, the poet and philosopher Paul Valéry was right: “The future, like everything else, is no longer what it used to be.” But we should not make fun of Marx’s well-known prediction error. After all, as the physicist Niels Bohr wryly noted, “Prediction is difficult, especially about the future.”
We now know that as the ink was drying on the Communist Manifesto, wages in Europe and the United States were beginning a 160-year-long rise, making workers part of the middle class, with cars, mortgages, pensions, and petty bourgeois concerns. Politicians today promise to create jobs – or more opportunities to be exploited by capital – not to take over the means of production.
Capitalism could achieve this transformation because the reorganization of production allowed for an unprecedented increase in productivity. The division of labor within and across firms, which Adam Smith had already envisioned in 1776 as the engine of growth, allowed for a division of knowhow among individuals that permitted the whole to know more than the parts and form ever-growing networks of exchange and collaboration.
A modern corporation has experts in production, design, marketing, sales, finance, accounting, human resource management, logistics, taxes, contracts, and so on. Modern production is not just an accumulation of buildings and equipment owned by Das Kapital and operated mechanically by fungible workers. Instead, it is a coordinated network of people that possess different types of Das Human-Kapital. In the developed world, capitalism did transform almost everyone into a wage laborer, but it also lifted them out of poverty and made them more prosperous than Marx could have imagined.
That was not the only thing Marx got wrong. More surprisingly, the capitalist reorganization of production petered out in the developing world, leaving the vast majority of the labor force outside its control. The numbers are astounding. While only one in nine people in the United States are self-employed, the proportion in India is 19 out of 20. Fewer than one-fifth of workers in Peru are employed by the kind of private businesses that Marx had in mind. In Mexico, about one in three are.
Even within countries, measures of wellbeing are strongly related to the proportion of the labor force employed in capitalist production. In Mexico’s state of Nuevo León, two-thirds of workers are employed by private incorporated businesses, while in Chiapas only one in seven is. No wonder, then, that per capita income is more than nine times higher in Nuevo León than in Chiapas. In Colombia, per capita income in Bogota is four times higher than in Maicao. Unsurprisingly, the share of capitalist employment is six times higher in Bogota.
In poverty-stricken Bolivia, Francis criticized “the mentality of profit at any price, with no concern for social exclusion or the destruction of nature,” along with “a crude and naive trust in the goodness of those wielding economic power and in the sacralized workings of the prevailing economic system.”
But this explanation of capitalism’s failure is wide of the mark. The world’s most profitable companies are not exploiting Bolivia. They are simply not there, because they find the place unprofitable. The developing world’s fundamental problem is that capitalism has not reorganized production and employment in the poorest countries and regions, leaving the bulk of the labor force outside its scope of operation.
As Rafael Di Tella and Robert MacCulloch have shown, the world’s poorest countries are not characterized by naive trust in capitalism, but by utter distrust, which leads to heavy government intervention and regulation of business. Under such conditions, capitalism does not thrive and economies remain poor.
Francis is right to focus attention on the plight of the world’s poorest. Their misery, however, is not the consequence of unbridled capitalism, but of a capitalism that has been bridled in just the wrong way.

- Government Gives Away Billions In Grants To Students Who Never Graduate
In “Who Is Stoking The Trillion Dollar Student Debt Bubble?,” we highlighted the rather disconcerting fact that in 2014, the US government gave out some $16 billion in loans to students attending colleges that graduated fewer than a third of their students after six years.
As WSJ suggested, accrediting agencies are part of the problem. “One problem may be that the accreditation game suffers from similar conflicts of interest as those which caused ratings agencies like Moody’s and S&P to rate subprime-ridden MBS triple-A in the lead-up to the crisis,” we argued.
In the end, the disbursal of billions in federal aid to students attending schools where they’re unlikely to graduate is, like lending to students that attend for-profit colleges that the government is fully aware will likely one day be shut down, just another example of the misappropriation of taxpayer funds.
Well, if you needed further evidence of this, look no further than the Pell grant program.
As NBC reminds us, “Pell grants are given to low-income families and, unlike student loans, do not need to be paid back – [they] are the costliest education initiative in the nation.”
Well, the costliest until the across-the-board debt forgiveness, but in any event, it turns out that despite the fact that taxpayers have dumped $300 billion into the program since 2000, “the government keeps no official tally of what proportion of those who receive the grants end up getting degrees.”

Now, a new report from The Hechinger Report shows that billions in taxpayer money is (literally) given away to students who never graduate. Here’s more:
A Hechinger Report analysis of Pell grant graduation rate data from a cross section of colleges and universities — which is not otherwise publicly reported anywhere — suggests that billions of dollars in taxpayer-funded Pell grants nationwide go to students who never earn degrees.
And while some schools with large numbers of Pell recipients have strong graduation rates for those students, the ones receiving the biggest share of the money often do not.
In a quirk of federal policy, individual institutions do have to disclose the graduation rates of their students who receive Pell grants, when asked. And while some resisted doing so, or released them only in response to public-record requests, the Hechinger analysis of 32 of the largest private and 50 of the largest public universities — and tens of thousands of Pell grant students — shows that more than a third of Pell recipients at those schools hadn’t earned degrees even after six years.
“We’re talking huge amounts of money and huge numbers of people,” said Richard Vedder, an economist and director of the Center for College Affordability and Productivity.
Pell grants cost taxpayers $31.4 billion in fiscal year 2015, more than double what was spent on them in 2007. Since then, the maximum award has increased by more than $1,200 per student per year and the number of students applying for the grants is up by 7 million.
The program has grown so fast that Republicans have proposed freezing the maximum annual Pell award at the current $5,775 for the next 10 years. The money given to the students first goes to the college to pay tuition and fees, and anything left over can be used for books and living expenses. Unlike loans, Pell grants do not have to be repaid, whether or not a student ever graduates.
Most recipients of Pell grants come from families earning less than $40,000 a year.
In January 2014, Congress gave the Department of Education 120 days to produce, for the first time, Pell grant graduation rates for every university and college in the country. The department finally released the months-overdue report in November, but did not break down the information by institution, citing problems with the data, and was only able to analyze 70 percent of Pell recipients. Only 39 percent of the 1.7 million students in its sample earned a bachelor’s degree in six years.

- "The War On Drugs Is Over, And We Lost… We Can't Arrest Our Way Out Of This"
Submitted by Claire Bernish via TheAntiMedia.org,
Situated on the coast of Massachusetts, Gloucester’s claims to fame include its status as “America’s original seaport,” as well as being the real-life location on which events in the movie The Perfect Storm (2000) were based. Now, the small town has a new reason to be the center of attention: its police have been granting complete amnesty to drug users who come to the station seeking help, even if they come bearing the remainder of their stash.
On March 6th of this year, Gloucester Chief of Police Leonard Campanello wrote a Facebook post much like he normally did. But this particular post bemoaned four deaths to heroin and opiates in just two months — for a city with less than 30,000 residents.
Frustrated, and without any forethought, Campanello added what would turn out to be a propitious statement to that post:
“If you are a user of opiates or heroin, let us help you. We know you do not want this addiction. We have resources here in the City that can and will make a difference in your life. Do not become a statistic.”
The response was immediate and overwhelmingly positive. Where one of Campanello’s typical posts would collect, perhaps, a dozen ‘likes’ — this post garnered 1,234 likes and, according to the Washington Post, “more views than there were people in the city.”
Obviously, he’d hit on the crux of a problem with the different approach that was sorely needed.
“The war on drugs is over,” Campanello said. “And we lost. There is no way we can arrest our way out of this. We’ve been trying that for 50 years. We’ve been fighting it for 50 years, and the only thing that has happened is heroin has become cheaper and more people are dying [emphasis added].”
On May 4th, he posted a lengthy update after considering what he’d stumbled onto with that first extemporaneous post.
“Any addict who walks into the police station with the remainder of their equipment (needles, etc.) or drugs and asks for help will NOT be charged. Instead we will walk them through the system toward detox and recovery. We will assign them an “angel” who will be their guide through the process. Not in hours or days, but on the spot. Addison Gilbert and Lahey Clinic have committed to helping fast track people that walk into the police department so that they can be assessed quickly and the proper care can be administered quickly [emphasis added].”
Though it was unclear what the repercussions of such a bold move would be, after over 33,000 likes and 30,000 shares for the updated post, there was no denying Campanello had found a better alternative to penalizing those struggling with addiction. Over 4,000 comments sang the praises of the program — a few even compared the approach to Portugal’s success decriminalizing all drugs. Most echoed sentiments like, “Well done!” and“Finally someone gets it right!” and even “Bravo!! More compassion and humanity in our justice system. You are leading by example. And I think the results will validate your decision [emphasis added].”
And validate they have.
Campanello said this week that over 100 addicts have already taken advantage of the opportunity — and one in six have come from out-of-state, including a person who traveled all the way from California to ask for help. It’s certainly a switch to see so many flock to the very police who, in the past, would have arrested and jailed every one of them.
“It’s extremely important for a police department to treat all people with respect,” said Campanello. “Law enforcement doesn’t exist to judge people.”
And as for cost? An update on the “Gloucester Initiative Angel Program” in an August 10th post stated: “$5000 for 100 lives.”
Going even further, Campanello approached a local CVS pharmacy and explained the program and the need for Nasal Narcan, which can reverse an overdose. Without insurance, the drug cost $140, but after hearing about the revolutionary program, CVS made it available for $20 a pack — so Campanello started providing it to addicts free of charge.
“The police department will pay the cost of the Nasal Narcan for those without insurance. We will pay for it with money seized from drug dealers during investigations. We will save lives with the money from the pockets of those who take them,” he said.
With so many people taking advantage of the program, Chief Campanello and the Gloucester Police Department, as well as their various partners, have formed a non-profit organization called The Police Assisted Addiction and Recovery Initiative (P.A.A.R.I.) “to bridge the gap between the police department and opioid addicts seeking recovery.” Its website states, “Rather than arrest our way out of the problem of drug addiction, P.A.A.R.I. committed police departments:
- “Encourage opioid drug users to seek recovery.”
- “Help distribute life saving opioid blocking drugs to prevent and treat overdoses.”
- “Connect addicts with treatment programs and facilities.”
- “Provide resources to other police departments and communities that want to do more to fight the opioid addiction epidemic.”
Though it is perhaps premature to estimate the program’s overall success, three Massachusetts cities will soon be implementing programs based on Campanello’s model.
What started as frustration and anger about the nation’s growing problem with heroin and opiate addiction hastily posted to Facebook has become a possible future model for police departments around the country — and tangible hope for addicts and their loved ones.
Four deaths in two months in the small coastal town appeared to indicate the continuance of a frightening trend — but in the over five and a half months since, there have been “Just two,” said Campanello.
In mid-June, Gloucester Police wrote another post on the official Facebook page that speaks volumes of the program. It states:
“A reporter asked one of my officers last night: ‘Do you see a common thread in all addicts?’ Without hesitation, the officer responded: ‘Absolutely. They’re all human beings.”

- Why Has The Government Stopped Reporting Lake Mead Water Levels?
For months we have been warning that "Vegas is screwed" as water levels continue to plunge in its most crucial reservoirs. Non-government experts are waving red flags that something must be done (and even NASA scientists fear the worst) while the government remains quiet. And then just 3 months ago, Lake Mead water levels mysteriously plunged to levels that were perilously close to emergency for Vegas water supply, then quickly reverted after the government confirmed that a malfunctioning indicator was at fault.
Now, we note, having given them time to 'fix' whatever problem there may be, Lake Mead water levels have not been reported since July 9th – six weeks??!!

As Jim R notes rather eloquently,
In the spirit of data obfuscation a la China and Obama, Lake Mead’s daily reporting has not been posted for six (6!) weeks.
At last report (July 9) the lake was 0.6 inch above the critical 1075’ level that will initiate a new round of water wars in the Southwest, including a possible crimp in the IV drip that sustains Phoenix and Tucson.
As a reminder,
If the water level is below 1,075 feet elevation – 4 feet below today’s level – by January 1, 2016, it will trigger a federal water emergency… and water rationing.
Las Vegas Review Journal reported that forecasters expect the level to drop to 1073 feet by June, before Lake Powell would begin to release more water. Assuming “average or better snow accumulations in the mountains that feed the Colorado River – something that’s happened only three times in the past 15 years,” the water level on January 1 is expected to be barely above the federal shortage level.
So, We have one simple question – why did the government stop reporting Lake Mead Water Levels six weeks ago?


Digest powered by RSS Digest
 Saving...
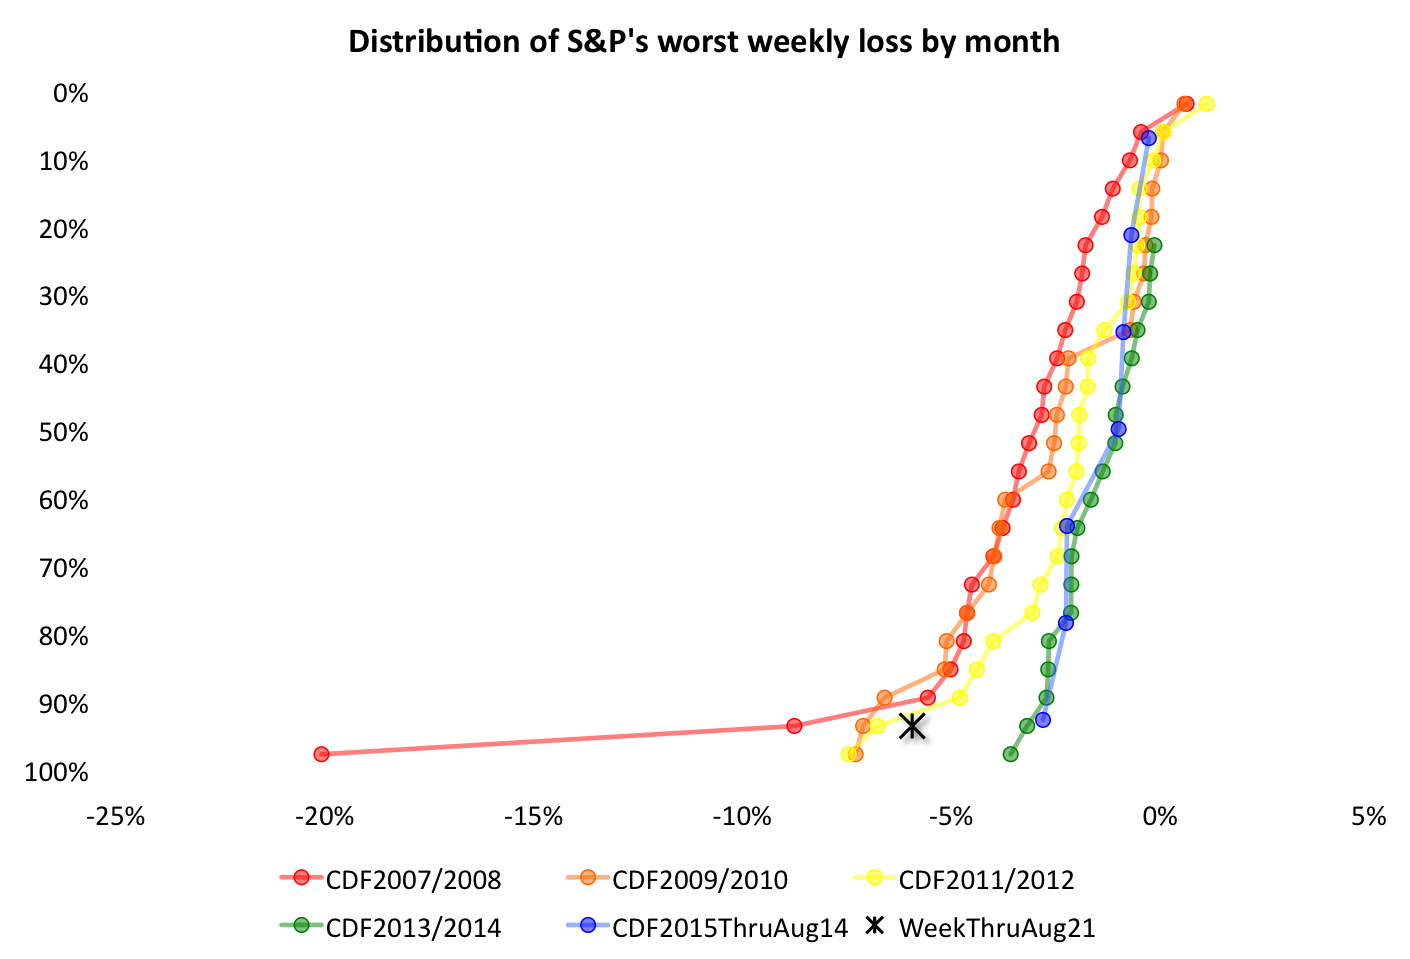