
- Q&A: Will China Stop Its Bleeding with Even Tighter Capital Controls?
By Chris at www.CapitalistExploits.at
Let’s look at a couple of questions from the readers today, shall we?
Hi Chris,
I love your sharing of thoughts. Really insightful and though you may not realise it, you’ve helped me a lot. I’m an entrepreneur running flat out. I’m juggling so many things, some inevitably fall through the cracks and yet I feel like I have to beat my competitors. You and your team there have such a long and deep experience in investing, including early stage investing. As such, I figure you’ve seen a lot of guys in my position. What suggestions do you have? I’m losing my mind.
Without knowing your business your comment reminded me of an event which sticks in my mind to this day.
Many years ago, as a teenager, I was on my way to a part time job. I had only recently begun driving, and as such my car was a heap of scrap, about as aerodynamic as a quarry face. One day, driving in traffic, I witnessed another guy who cut me off as he was in a desperate hurry, trying to dodge in and out of two lane traffic going in the same direction. He was driving a lovely shiny new BMW and was red faced, and clearly about as agitated as a mosquito bite in the heat.
I was in no particular rush and just going with the flow listening to music. The journey to my place of work was about 20 kilometers. When I arrived into the car park, lo and behold, there was this guy climbing out of his car. He’d managed to dodge, weave, drive his car as hard as he could, when he could, and emotionally was close to snapping. He had arrived at the same destination maybe 40 seconds before me but in a completely different state.
What he should have done really is use his time as effectively as he could. He was trying to do something which was out of his control, namely get to where he was going faster than was really possible given the circumstances.
I’m as guilty as anyone on this but it’s really important to focus on what’s important not what’s urgent. Understand that they’re not the same thing.
Now, this next comment is not something I would normally bother publishing but I thought I’d share it since it does show some of the current zeitgeist where unsophisticated investors will make decisions not on any intellectual thought process but on something as inane as how many Twitter followers someone has. Social media reigns supreme.
I was put onto your site by my financial advisor. The material is interesting but I notice that you’ve not got a lot of Twitter followers.
Mmm… OK, then. Maybe I should focus less on investing my capital and more on my Twitter followers. I could care less if I only had 12 followers. Seemed to work for Jesus…
If I stopped posting any content would the value of my thoughts and investment insights be less? As a matter of interest, I receive daily solicitations from “internet marketing professionals” who will deliver me any number of Facebook fans, Twitter followers, LinkedIn friends and more. Just sayin’.
Onto the next one…
Hi Chris,
Thanks for the fantastic analysis of the RMB. I signed up literally just in time. I think the second article I read was on shorting the RMB and it made sense so I put it on even though at the time I stubbornly felt that the USD was going to hell. Something I’ve changed my opinion on after reading through your many posts and reports on the topic.
I read a lot of commentary suggesting the the RMB would become the new world currency and that it would revalue higher. Your work was less emotional and just looked at the facts which swayed me.
My question, if you’d be so kind to answer. You guys detailed how the USD carry trade created a demand for RMB but surely when those dollars enter China, or any recipient country they would ultimately land up as foreign exchange reserves. Furthermore, China then would have massive USD foreign exchange reserves meaning that the RMB should be more not less stable in a dollar rally. How do you think about this?
Thank you! I suggest you try to forget about the noise and look at the numbers first. Once you’ve looked at the data then listening to divergent opinions is much easier. You’ll rapidly identify a professional from random opinionated people cluttering the net selling fear, mayhem and catastrophe at every corner, or whatever is the flavour of the day (see my comments about Twitter above).
To answer your question. When the dollars came into China, largely due to them being made incredibly cheap due to Fed induced QE, this put upward pressure on the RMB – something the PBOC didn’t want. As an example, if you invested capital into something like a RMB CD then those dollars end up on the balance sheet of the Chinese bank. Chinese banks however aren’t typically in the business of lending out dollars but rather RMB. As such they sell the USD in the interbank market to obtain RMB which they can lend out. Banks are in the business of lending.
That particular trade would cause downward pressure on the dollar (sale of dollars) and that’s not a good situation for an export driven economy such as China. As such the PBOC comes in and buys those dollars but to do so they print RMB thus creating a balance sheet debit. They effectively sterilize the purchase of RMB made by the Chinese bank.
Everyone was happy with this scenario as dollar financing of China’s boom continued, GDP growth targets kept being met, and the RMB peg to the dollar was largely kept in check. What’s more the RMB – even though sterilization was occurring – was allowed to rise, thus creating a risk cushion on the currency swap by those short dollars. This itself incentivized more of the same behaviour.
The problem is that for every action there is a consequence to that action. The net result is the PBOC balance sheet expanded as they either issued RMB denominated bonds or bills in exchange for the purchase of those dollars. They now have yuan denominated liabilities in massive quantities.
This all worked so long as growth continued and so long as those RMB which the original bank had now lent out went into productive assets and there was no loan quality deterioration. Of course, that’s not what’s been happening. Since such large quantities of dollars were pouring into China, based on the growth story, so too the PBOC was creating insane amounts of RMB to sterilize those incoming dollars.
That incredible creation of RMB had to go somewhere and it’s gone into, among other things, building of famous Chinese ghost cities. The incentive for this behaviour was compounded by the fact that Chinese government officials are rewarded based on GDP growth. Building useless ghost cities shows up as GDP growth but it’s completely unproductive despite what Paul Krugman may have to say about it.
This is now a problem on multiple fronts:
- QE in the US has stopped and those same stimulative policies have NOT stopped in countries such as China. This divergence helps to create an additional bid for the dollar. The Fed doesn’t need to raise rates right now as there exists a synthetic tightening. When the rest of the world is easing and the US stops easing then this is dollar positive.
- The China growth story is now seriously in question. Without continued growth the trade unwinds.
Combine this with the size of the carry trade we’ve discussed at length, and we have an incredible setup to make a lot of money as this plays out. What will continue to take place is foreign exchange outflows from China. At what point do we not just call it what it is? Capital flight.
History tells us that capital flight is often followed by tighter capital controls, and ironically it is capital controls which will only exacerbate the pressures, meaning that when the final twig snaps the collapse comes all the harder. The pressures for China to devalue will only continue to mount and implementing tighter capital controls will not aid China in its bid to have their currency included in the SDR basket by the IMF.
– Chris
PS: If you enjoyed this note then you might also want to receive future write-ups just like this one as well as periodical subscriber-only free reports and more (no spam, though). We’re consistently building upon our investment framework, shared with you in these notes and we welcome the widest possible participation, as well as your thoughts and comments. You can join us HERE.
“The function of leadership is to produce more leaders, not more followers.” – Ralph Nader

- Confusion: US Equities Drift Lower (China Higher), Yuan Surges & Purges As China Manufacturing Misses (And Beats)
Confusion reigns… China's Manufacturing PMI is in contraction according to both the Official and Markit/Caixin measures (but the former was flat and missed while the former rose and beat "confirming economic stability" according to the 'official' press). Following the largest strengthening fix for the Yuan in 10 years, both the onshore and offshore Yuan are weakening by the most since the August devaluation. Finally, having cliff-dived at the open, Chinese stocks have bounced back to unchanged on the Ciaxin PMI beat (but US equities drift lower still).
It's a rise and a beat & a miss and a drop for Chinese manufacturing…

The last two times the Caixin measure has diverged positively from the official data, it has converged lower in the next 3 months.
After the biggest strengthening fix in 10 years…

Onshore (and offshore Yuan) are weakening by the most since the August devaluation…

Compressing the Onshore/Offshore spread back to zero…

And finally Chinese stocks tumbled on the weak 'official' PMI and surged back to unchanged on the Caixin PMI…

But US equities saw no such bounce as hopes for moar easing fade after comments on "stability" after the Caixin print…

So chaos reigns once again…
Charts: Bloomberg

- Here Are The Five "Good News" That Can Cause A Market Selloff According To Bank of America
“If bad news is great for stocks, then is good news bad?”
Bank of America reminded us earlier that just this month, the PBoC cut rates, the ECB confirmed QE2, Sweden announced additional QE, and the BoJ promised additional easing if necessary ‘without hesitation’, and for markets, “the stimulus of October 2015 has worked, with equities and corporate bonds rallying hard.“
The main driver of this newly unleashed central bank intervention? Terrible global economic data.
BofA further says that “central banks are easing because global growth is weak” (in the process making global growth even weaker but at least pushing risk assets to new highs) adding that “global profits are down 4% since February. Even the US has struggled: payroll growth has decelerated and the latest US GDP growth rate was a pitiful 1.5% in Q3. And the level of US inventories is unambiguously recessionary.”
But while “confidence in quantitative success for the economy is nonetheless low” the ‘loss of faith in central planning’ trade which emerged briefly in late August and September, promptly fizzled as “don’t fight the Fed” once again regained its top position on the pantheon of Wall Street aphorisms, right above BTFD.
So if terrible economic news is great for stocks, will the opposite be true as well, especially with a resurgent hawkish Fed and odds of a December rate hike soaring to the highest level yet?

Here are the five “good is bad” things which according to BofA, will change the narrative, and lead to a market selloff in November.
What changes this narrative? What signals Q3 was the trough for macro expectations? What causes a market sell-off in bonds in November? Strong October data & market validation of a higher rates/higher growth scenario in coming quarters:
- China PMI>50.5
- US ISM>52
- US payroll>225K
- US banks rally: XLF>$26 would confirm stronger “domestic demand” expectations.
- US dollar stable: if the Fed can hike without boosting dollar this is positive; DXY must not breach 100; a rally in ADXY (Asia FX index) above 110 crucial as this would erase the apocalyptic view of China growth prospects.
There is another potential adverse catalyst: while often cited as a source of market strength, the end of Obama’s second term may be just the opposite.
The “Wall Street boom, Main Street bust” narrative is one central banks would very much like to avoid in 2016, especially as 2016 is a US election year. And it’s worth noting that the end of a two-term Presidential cycle has often signaled the end of an excess valuation somewhere in the global financial markets: the overvaluation of the US$ after JFK/LBJ, the undervaluation of bonds after Ford/Carter, the overvaluation of tech after Clinton and the overvaluation of housing after Bush (see Chart 7).

Will the S&P crash at the end of 2016? We won’t know, but it certainly would be a fitting conclusion to Obama’s second term if the stock bubble, the only thing Bernanke Yellen Obama “got right” and doubled it (at a cost of only $10 trillion in government debt), were to wipe out all its gains since 2009 and confirm to everyone just how naked the US president had been all along.

- Partner Of "China's Carl Icahn" Executed By Local Police After Attempting Escape Following Insider Trading Charges
The name of Shanghai’s Xu Xiang is not a household name in US financial circles. It is in China.
According to a recent profile in Want China Times (as of May 2014) Xiang, who heads the Shanghai-based Zexi Investment (founded in 2009 and since then generating literally impossible returns) is not only one of the richest Chinese investors, but has been called anything from China’s “Warren Buffett” to China’s “Carl Icahn.” He also has a reputation of being an activist within China’s stock market. To wit from May 2014:
The major players in China’s capital market, including equity fund and insurance asset management firms, are gearing up to secure seats as members on the boards of directors in listed companies in a bid to influence these firms to give dividends, putting profit into their own pockets, according to Guangzhou’s Time Weekly. According to the newspaper Xu Xiang, head of Shanghai-based Zexi Investment, is one among these market players in China.
Xu, from Ningbo in eastern China’s Zhejiang province, built his wealth from scratch through investments in the secondary capital market. Xu set up Zexi Investment in 2010 and gained a good reputation as a profit maker in the Chinese equity fund market. The fund is reported to currently manage more than 10 billion yuan (US$1.6 billion).
A statistics report on the Shanghai stock exchange revealed that Zexi Investment has raised its stakes in several listed companies, including in conglomerate Ningbo United Group, since the beginning of this year. Xu’s investments have made Zexi more visible in the Chinese capital market.
The newspaper reported that Xu’s strategy is not unusual in the US market and is similar to that of Warren Buffett, a prominent US equity investor, although this style is not often seen in China. The report said it is believed that more and more Chinese investors will follow Xu’s example by getting selected as members of the board of directors in listed companies to influence the companies.
A manager in an equity fund firm, who declined to be named, told Time Weekly that Zexi had tried the same technique previously with Sino Life Insurance and Anbang Insurance Group. The fund manager suggested that insurance asset management companies invest in the secondary market.
Xu has been called the Chinese version of American investor Carl Icahn. Icahn, 77, has repeatedly made his presence felt in the equity market, boosting his stakes in several major firms on Wall Street, such as Dale, Apple, and eBay.
Zexi also appeared in US mainstream news late last week, as a result of Bloomberg’s report that while China’s stock market was crashing, “the country’s top 10 performers, run by Ze Quan Investment, Sunrise Investment, Zexi Investment and Yingyang Asset Management, found gains in the June-August period.” As the following Bloomberg chart shows, four of Zexi’s funds were among the top 10 performing hedge funds from June to August.

It gets better: according to Zexi’s own website, the return of its various funds since 2010 is as high as a mindblowing 3944.9%!

And then, perhaps related to Zexi’s tremendous outperformance, Xu’s name once again emerged late on Sunday in China, because as China’s Global Times reported, “Xu Xiang, general manager of the Shanghai-based company Zexi Investment, is under investigation for suspected inside trading, the Ministry of Public Security announced late Sunday.”
Xu and several others allegedly obtained inside stocks information via illegal methods and participated in insider trading and manipulating stocks prices, a ministry statement said.
The suspects have been placed under coercive measures, which include summons by force, bail, residential surveillance, detention and arrest.
That is all the pithy announcement by the People’s Daily-affiliated newspaper had about the unexpected arrest of one of China’s capital markets scions over “insider trading” charges.
Ok, this is China: crazy things happen all the time. But where things got outright ridiculous, was when moments ago when as China National Radio reports, Wu Shuang, a partner of Xu Xiang’s at Zexi, and also an insider trading suspect, was shot and killed by Chinese police when he “resisted and tried to escape.” The complete, google-translated brief note:
Further investigation by the Ministry of Public Security, Xu Xiang criminal gang suspected of insider trading and other offenses are criminal detention. A member of their criminal group Wu Shuang tried to resist escape, the police shot on the spot.
And that was it.
In fact, that was not even it, because moments after the report (which had been corroborated by Bloomberg) was released, CNR promptly 404’ed the entire story.

And that’s not all: moments ago Bloomberg also reported that Shanghai police just raided Zexi Investment’s Shanghai office on Sunday, “taking away computers and other materials, according to a person familiar with the matter, in the latest attempt by Chinese authorities to crack down on strategies blamed for exacerbating a $5 trillion stock-market rout.”
So what is the fate of Wu Shuang, or billionaire Xu Xiang for that matter? We probably will never know, although we have a feeling that a slot for China’s “next Carl Icahn” has just opened, especially since as of right now, trying to open the non-cached version of the Zexi Fund (the cached one can still be found here), has just been 503’ed, a fate we are certain has befallen its executives as well.

- The Military-Industrial Complex's Latest Best Friend – Barack Obama
Submitted by Chuck Spinney via The Blaster blog,
The Pentagon just won another small skirmish in its long war with Social Security and Medicare. That is the unstated message of the budget deal just announced gleefully by congressional leaders and the President. To understand why, let’s take a quick trip down memory lane.
Last January, President Obama submitted Fiscal Year (FY) 2016 budget to Congress, and he proposed to break the spending limits on both defense and domestic programs. These limits are set by the long-term sequester provisions of the Budget Control Act of 2011 (BCA), which, for better or worse, is the law of the land, and Obama was asking Congress to change the law. Mr. Obama wanted to finance his ramped up spending proposals by increasing taxes. Of course, he knew that the Republican controlled Congress lusted for defense increases but hated domestic spending, particularly entitlements. Moreover, he knew increasing taxes was like waving the red cape in front of the Republican budget bulls. So, he knew his budget would be dead on arrival. Obama’s budget, nevertheless, had one virtue: it was up front about the intractable nature of the budget problem. In effect, whether deliberately or not, Obama laid a trap that the Republicans merrily walked into during the ensuing spring and summer.
Obama's gambit set into motion a tortured kabuki dance in the Republican controlled Congress. The Republicans, as Obama well knew, wanted to keep up the appearances of adhering to the BCA. But at the same time, they wanted desperately to shovel money into the Pentagon’s coffers. The net result was that Obama’s proposal triggered a series of increasingly irrational Congressional negotiations, bizarre back-room deals and weird budget resolutions. These machinations came to a head with the passage of a National Defense Authorization Act (NDAA) that proposed to (1) keep the Pentagon’s base budget at the BCA level of about $499 billion, but (2) pack the accounts in the Pentagon’s Overseas Contingencies Operations fund (OCO) with a programs and pork that should have been in its base budget. The reason for the dodgy OCO 'slush fund' rested in the politically irresistible fact that the OCO is a separate war-fighting fund** for the Pentagon that is exempt from the spending limits set by the BCA’s sequester provisions. The net result of the smoke and mirrors by the Budget and Armed Services Committees of Congress was a total defense budget that was almost identical to Obama’s original submission, but one that was not accompanied by his domestic funding increases or his tax increases. And this monstrosity was all wrapped up in a ridiculous pretense of adhering to the BCA limits.
Last week, President Obama seemed to close the trap by vetoing the 2016 NDAA. But this too was smoke and mirrors.
The veto put in motion yet another kabuki dance, this time behind closed doors between the White House and the leaders of Congress. The goal was to reach an overall budget deal that would avoid a government shutdown, which the majority Republicans were terrified of being blamed for on the eve of an election year. At the same time, they wanted to dodge the BCA’s sequester bullet while they shoveled more money into the Pentagon.
That deal has now been joined, and the Republic has been saved, albeit at an unknown price. Nevertheless, some of the sordid details of that price are now beginning to seep through the chinks in the Hall of Mirrors that is Versailles on the Potomac.
According to this report in Defense News, the elements of the budget deal include:
The deal raises the BCA spending caps (again) by $80 billion over next two years; including $50 billion in FY2016 and $30 billion in FY2017. It also increases the Federal Government’s debt limit.
These spending increases would be split equally between defense and domestic programs, and they would be financed by two squirrelly provisions, to wit:
The first financing gimmick cuts back Medicare and Social Security disability benefits. But if past is prologue, the cut to Medicare is likely to be reversed again next year, which is an election year — because everyone in Congress wants the endorsement of the American Medical Association (AMA). The cut to Medicare providers was first made permanent law by the Balanced Budget Act of 1997, and since then Congress has reversed the scheduled provider cut 17 times.
The second financing gimmick is to sell crude oil from the US Strategic Petroleum Reserve. Ironically, this rather bizarre provision is peculiarly fitting to the culture of Versailles on the Potomac. Few remember that the reserve was justified to the American people in 1975 as an insurance “cushion" to reduce the adverse effects of future rises in oil prices or supply disruptions engineered by OPEC, which is controlled by our supposed “ally” Saudi Arabia. So why sell the reserve's oil when prices are near record lows (adjusted for inflation) compared to those of the last fifteen to twenty years, particularly since the Saudis are flooding the market to take out the US frackers? Who benefits is a fascinating question with all sorts of twists and turns and is not yet answered. But it is worth recalling the 1997 Balanced Budget Act had a provision to sell the Naval Petroleum Reserve at Elk Hills (sold in 1998) – at that time, the largest privatization of government assets in history, precisely when oil prices were at their lowest level (adjusted for inflation) since the 1960s. They sold it to Occidental Petroleum which made a killing.
There is one thing the deal makes clear, however. The Pentagon's share of the spending increases would be $33 billion in FY16, made up of a $25B increase in the Pentagon’s base budget and an $8B increase in the OCO. As for how the Pentagon’s $15 billion increase in FY17 will be allocated, the report in Defense News is silent.
So, there is good reason why champagne corks are popping in halls of the Military – Industrial – Congressional Complex (MICC) and its lobbying affiliates on K Street. Indeed, to celebrate the triumph, the AF immediately announced it awarded Northrop-Grumman a huge concurrent engineering contract (Milestone B) to design and build the first 21 of 100 new long range strike bombers, which heretofore had been shrouded in heavy secrecy. No one knows what this bomber will even look like, let alone what the program will cost, but two years ago, there were reports of a “pre-cost-growth” total program cost estimate (R&D and production) reaching $81 billion. At least one of the MICC’s euphoric wholly-owned subsidiaries in the Fourth Estate has already written that 100 bomber is not enough, given the threats we face and the number of aging bombers that need to be replaced.
This new bomber program is by far the largest weapon acquisition program yet started in the 21st Century. Yet there has been no oversight, except by its advocates in the smoke-filled, super-secret secure compartmented information facilities (SCIFs) spread around Versailles. Moreover, the bomber's heavy concurrency means that the production-related money will quickly start flowing to hundreds of congressional districts, well before it is designed. So, before you can say sequester next year, the Bomber, like the troubled F-35 Joint Strike Fighter, will be unstoppable. And, like the F-35, it will acquire a life of its own to live on, no matter how badly it fails to meet its cost goals, its capability specifications, or its production quotas — for the simple but powerful reason that a majority in Congress are being bought off today in a way that will ensure they vote for it tomorrow.
But there is more. The new Bomber is just the beginning of the new defense boom that Mr. Obama and Congress are launching beneath the smoke and mirrors of their budget practices. The Pentagon already has a bow wave of increased spending for new weapons in its R&D pipeline. In that sense, it is no accident that, a year ago, as he was departing the Pentagon, the Pentagon’s ineffectual comptroller Robert Hale characterized the new bomber as the “canary in the coal mine.” He was wringing his hands over the rapidly growing requirements for larger defense budgets in the future — requirements he helped to create. Bow waves are a perennial feature in Pentagon planning. I first heard the term in 1973. The current bow wave, like its predecessors, will lead inexorably to more budget crises and more dodgy budget deals made by the best government money can buy.
So, once again, Mr. Obama had a shot at leading from the moral high ground, and once again, he blew it. He had the Republicans on the ropes, with all their warts on full display, but then he squandered an opportunity to effect even a pretense of challenging a thoroughly corrupt system. Obama’s most recent performance is yet more proof that he is no change agent. A better characterization would be that he is merely another Manchurian Candidate, whose role is to protect the interests of the factions making up the shadow government that is now running the show – what former congressional staffer Mike Lofgren calls the US Deep State.***
* * *
* This essay is the second in a series of occasional essays on the nature of defense spending. The first can be found here.
** The OCO is a George W. Bush gimmick, created in 2001 after 9-11 to capitalize on the national hysteria to pay for the Global War on Terror by taking its costs off the books. All our previous wars — e.g., WWI, WWII, Korea, Viet Nam, Kosovo — were funded out of the “base” defense budget and there was no need set up a special war fighting account.
*** Lofgren a former Republican congressional staffer on the House and Senate Budget Committees has written an important new book, The Deep State: The Fall of the Constitution and the Rise of a Shadow Government. It will hit the stands next January.

- Things You'll Never See
- PBOC Fixes Chinese Yuan Higher By 0.54%, Most Since 2005
On Friday morning, after the biggest surge in the onshore Yuan in a decade, we explained it as follows: “capital controls are to some extent counterintuitive. That is, the stricter the capital controls, the more people want to move their money out of the country. Here’s how we put it last month: “What better way to spark a capital exodus than with very vocal, and very effective capital controls. Just look at Greece.”
Indeed, China will likely need to completely liberalize the capital account in the coming years in order to pacify the IMF which is poised to throw Beijing a bone and grant its RMB SDR bid. Inclusion could lead to some $500 billion in reserve demand.
That helps to explain why overnight, the yuan soared the most in a decade after China moved to loosen capital controls with a trial program in the Shanghai free trade zone that would allow domestic individuals to directly buy overseas assets. The move marks another step towards capital account convertibility, thus bolstering Beijing’s bid for yuan internationalization.
Ironically, this did absolutely nothing to ease the local population’s concerns that capital outflows are accelerating, and certainly did nothing at all to help the Chinese export economy, which as we saw from the overnight PMI numbers, deteriorated once more to new cycle lows.

Fast forward to today when Westpac strategist Sean Callow said that the Froday jump in yuan’ spot rate on Friday and weaker dollar since last week’s close could mean largest daily gain in yuan fixing in several years, adding that the obvious policy priority for stronger yuan essentially sidelines fixing models for time being.
Sure enough, as per the fixing limits established as part of the August 11 Yuan devaluation, moments ago the PBOC announced that it had set the Yuan at a USDCNY fixing of 6.3154, a strengthening of a massive 0.54% – the most since 2005 – following the manic end of trading PBOC intervention on Friday that sent the Yuan soaring some 300 pips from 6.3475 to 6.3175.
So while the Chinese capital outflow is accelerating with every passing day, and which may now be best seen in the daily surge in the price of Bitcoin which has become a preferred means of circumventing China’s strengthened capital controls…

… China is well on its way to not only filling the entire devaluation gap, but slamming its export industries with an increasingly stronger currency, and thus assuring that any stabilization in the Chinese economy is promptly wiped away.

- Putin's Approval Rating Reaches A New High
Submitted by Pater Tenebrarum via Acting-Man.com,
Regime Change Must Wait …
According to a report at Russia Insider, something we thought would be nigh impossible has just happened – Vladimir Putin’s approval rating in Russia has soared to yet another all time high:
“Russian President Vladimir Putin’s approval rating has reached historical maximum and hit almost 90%, according to a poll conducted by Russian Public Opinion Research Center (WCIOM). Putin’s approval rating has broken a new record reaching 89.9%. The last record was registered in June 2015 — 89.1%
According to WCIOM, ‘such high rating of approval of the Russian president is registered, first of all, in connection with events in Syria, Russian aviation’s airstrikes at terrorist positions.’ Sociologists reminded that the Russian president’s rating has remained higher than 80% for the last two years. ‘Putin’s rating started growing in spring 2014 against the backdrop of Russia’s reunification with Crimea and Sevastopol. In March 2014, the rating stood at 76.2% on average, in April — at 82.2%, and in May — at 86.2%,’ WCIOM said.

Putin adorned in his presidential ray-bans. He’s never been more popular in Russia
We have put together a chart of Putin’s approval rating history by using the most recent chart available from the Levada Center (another Russian polling company) and complementing it with the result of the recent WCIOM survey (unfortunately we couldn’t find a chart of the WCIOM poll’s history, but various news reports that on Putin’s rating that have appeared over time suggest that the two polls are tracking each other very closely, so this amalgamated chart should serve):

The Levada Center’s Putin approval rating survey, with the latest WCIOM survey result added at the end – click to enlarge.
In short, all those who don’t like Putin or were hoping for some sort of regime change in Russia continue to be out of luck.
Mainstream Media, Here and There
One reason why we are even posting about this is that the Western press has also reported on the event, employing a somewhat less neutral tone of voice. For instance, the Washington Times writes: “Putin’s approval rating hits new high as Russia’s state media sells Syria campaign”
“From triumphant reports about the “liquidation” of “terrorist training camps” to Kremlin-friendly analysts praising Moscow’s growing international influence, the official media’s coverage of Russia’s dramatic entry into Syria’s more than 4-year-old civil war has been decidedly upbeat — and one more reminder of the Kremlin’s ability to dictate the terms of popular debate.”
Given that terrorist camps are apparently indeed liquidated by Russian air strikes, the Russian state media are not entirely wrong in this case. As Zerohedge recently reported, in a quite stunning recent development, even Iraq and Jordan are now cooperating with Russia and asking it to help them with subduing IS. They must have been impressed by something the Russians have done (very likely they are actually giving IS discernible problems).
However, what makes the above sour grapes style reporting (no doubt echoed elsewhere in the Western media) especially funny is that while it is true that the Kremlin exerts extraordinary influence on the media in Russia, one wonders in what way their reportage on Syria is different from the reporting in the happily self-censoring US mainstream media on the Iraq war, especially in the run-up to said war.
We seem to recall that there was unquestioning support of the administration’s quest to sell a war that was transparently based on little but lies. Anyone with an IQ above room temperature could simply not help realizing that the public was misled. The “free press” was happy to supply truly cheap propaganda in generous gobs (regardless of its presumed political leanings; e.g. the pro-socialist NYT was among the newpapers arguing most forcefully in favor of war and reported even the most ridiculous administration talking points as if they were gospel).
This was as blindingly obvious as the propaganda dished up by the Pravda in Soviet times. In fact, the handful of people who dared to ask questions when there was still time to potentially reconsider the administration’s course received almost Stalinesque treatment (this continues to this day, only now the people getting the “treatment” are those who dare to question US policy vs. Russia).
So this is clearly a case of the pot calling the kettle black. Who cares if the media are state-owned or if they are owned by a tiny corporate oligarchy that is in cahoots with the State? The result is exactly the same. This is not to say that Kremlin control over the Russian media deserves approval – far from it. When Putin kicked out the Yeltsin era oligarchs who basically ordered the latter’s government around as they pleased, he inter alia got rid of two media moguls. One of these, namely Boris Berezovsky, was probably the most powerful man in Russia during the Yeltsin era.
Evidently Putin quickly realized that exerting control over the media would be to his advantage, and so his government started to suppress dissenting voices while giving pro-government propaganda a great deal of room, especially on TV. However, on average the citizens of Russia aren’t any less perceptive than the citizens of other nations. Roughly 107 million Russians are e.g. using social media, so we can assume that Russians are in general fairly internet-savvy.

Russian social media users, in millions.
Similar to how this works in the US, it is very easy for the Russian government to whip up nationalist fervor when it is conducting a military intervention abroad. Those questioning the wisdom of interventions will naturally be few and far between, but we are sure they know where to get their information, regardless of what is broadcast on TV.
In an ironic twist, the places in the developed world where the population nowadays looks askance at any type of military engagement from the very outset are Germany and Japan – regardless of the rationalizations offered in its favor.
Possible Social Mood-Related Implications
Another aspect worth considering is that Putin’s consistently high approval rating is beginning to align with the trend of the Russian stock market – at least in ruble terms. Readers may recall that we once pointed out that president Bush’s sharply declining approval rating during his second term was one of several warning signs for the stock market at the time, as it indicated that the underlying social mood in the US was increasingly diverging negatively from stock prices.

The MICEX Index, daily – surprisingly, it has maintained its recent uptrend in spite of oil prices weakening again and the ruble strengthening somewhat (on Tuesday the ruble has sold off sharply, but it remains quite a bit above its August low).
Since the Russian stock market has given back about half of the gain it achieved earlier this year in dollar terms due to the weaker ruble (it rose by more than 40% in the space of five months in the first half), this is something one should keep an eye on, as opportunity probably continues to beckon. Eventually a more positive social mood should also be reflected in a stronger or at least stable currency.
We realize of course that Russia’s economic fundamentals are quite weak at present, but they are not as weak as might have been expected in view of the decline in the oil price. Moreover, the currency’s value is primarily a matter of monetary inflation, yields and inflation expectations, and from these perspectives the ruble actually doesn’t look unattractive, ceteris paribus.
Obviously, the oil price still represents a wild card at this juncture – its recent weakness has at least for the moment weakened the case for a potential trend change we have discussed in these pages a few weeks ago (we currently assume that the bottoming process is simply becoming more drawn out). Conversely, if a trend change were to actually happen, it would lend strong support to the ruble and the stock market.
Conclusion
Putin is proving remarkably durable as a politician. It is ironic that his approval rating is actually better during the current recession than it was during the preceding upswing, but one should never underestimate the emotional appeal of nationalism. We have little doubt that he indeed enjoys strong voter support (e.g. the Levada Institute is well-known for the quality of its data).
Russia’s economic situation has forced the Putin administration to adopt a number of economic reforms as we have previously reported. While we are currently not sure whether these proposals have been fully implemented or how successful their implementation was/is, the pressure that has led to their adoption remains in place.
Although the performance of the stock market and especially the ruble obviously remains highly dependent on energy prices, we continue to believe that the Russian stock market represents an opportunity based on valuation considerations alone. It is still the cheapest stock market in the world, and usually tends to magnify EM rallies. Also, once it gets going, it usually runs up a lot in a very short time, so it is often interesting from a shorter term trading perspective as well.

- Peak Unicorn
Things are getting crowded in the once-exclusive unicorn club…
This is all still-private unicorns since 2011 and charted them based on when they first joined the unicorn club.

(click image for large legible version)
While initially the chart shows unicorns being created at a relatively calm pace, the rhythm accelerates noticeably in late 2013 (right around the time Aileen Lee wrote her famous post coining the term unicorn in November 2013). Since then, there has been an explosion in unicorn creation, with over 60 new unicorns in 2015 alone.
Source: CB Insights via Valuewalk.com

- Homicide Rates Cut In Half Over Past 20 Years (While New Gun Ownership Soared)
Submitted by Ryan McMaken via The Mises Institute,
The Pew Research Center reported last week that the murder rate was cut nearly in half from 7 per 100,000 in 1993 to 3.6 per 100,000 in 2013. Over the same period, overall gun deaths (including accidents and suicides) have fallen by one-third from 15.2 to 10.6 per 100,000.
In spite of this, Pew reports, the American public believes that homicides and gun deaths are increasing in the United States. Those who think violence is getting worse should probably watch less television and look around them instead. The murder rate in the US is currently similar to 1950s levels.
Meanwhile, the number of privately owned guns (and gun commerce in general) in the United States has increased substantially in recent decades.

Source: Firearms Commerce in the US, Annual Statistical Update. (From BATF)
According to the World Bank, here are the homicide rates in the US since 1995:

Here's the homicide rate graphed against total new firearms (manufactured plus imported) in US (indexed with 1995 =100):

Meanwhile, in Mexico, where the US Consulate counsels Americans to not even carry pocket knives in the face of "Mexico’s strict weapons laws." There is exactly one gun store in Mexico. In short, the Mexican experience is a perfect example of the effect of prohibition. A lack of legal access to guns leads to a need for illegal access.
The murder rates in Mexico:

Mexican politicians complain that weapons are easily smuggled from the United States, and that is the source of their problem. But if access to guns is the problem, shouldn't murder rates be much higher in the United States? Moreover, if gun smuggling is such a problem in Mexico, this is just another piece of evidence showing the weakness of prohibition laws in preventing access to the intended target of prohibition.
Naturally, we can't blame everything on gun prohibition in Mexico, nor can we attribute the murder rate decline solely to more guns in the US. But we can say two things for sure: (1) Gun restriction in Mexico has not prevented enormous increases in the murder rate, and (2) increases in gun totals in the US have not led to a surge in the murder rate.

- US, Japanese Stocks Extend Losses; Turkish Lira Soars Most In 7 Years As Gold Mini-Flash-Crashes
Despite the world seemingly exuberant at Turkey’s fraud election, sparking the biggest rally in the Lira since Nov 2008 (confirming once again that “markets love totalitarian governments,”) it appears the centrally-planned machinations of the US equity markets are not living up to their promises of wealth for all (and rate-hikes don’t matter). US and Japanese equity futures are opening notably lower, erasing all of the post-Fed exuberance with Dow Futs down over 200 points from pre-BoJ hope highs. Finally, gold futures were hammered lower at the Asia open (on heavy volume) only to rip back to practically unchanged.
Lira loves the ‘fix’…

Biggest daily jump since Lehman…

Someone decided the thinly-traded pre-open markets on a Sunday night was an opportune time to flush 10s of thousands of ounce of paper gold (around $228 million notional) into the market…

And maybe higher rates are bad after all…

Japanese stocks are tumbling

As the world, contrary to a surge in pent up expectations that China is finally fine, realize that it isn’t following this weekend’s miss in both the Manufacturing PMI, and slide in the non-manufacturing PMi to the lowest level since 2008.

Finally, was the hawkish Fed hawkish not just to punk another iteration of Eurodollar/FF traders, but because its FRB/US model actually believes that there is no more slack in the economy and a December rate hike is imminent as reported earlier?


- "What The Heck Is Going On Here"
Succinctly summarizing the state of the mainstream media’s cognitive dissonance at the state of ‘real’ America…


- Ban Ki-Moon Condemns The American Stand On Syria, Endorses Putin's
Authored by Eric Zuesse,
In an interview with Spanish newspapers that was published October 31st, U.N. Secretary General Ban Ki-Moon condemned U.S. President Barack Obama’s demand that Syrian President Bashar al-Assad be removed from office, and Moon said: “The future of Assad must be determined by the Syrian people.”
Here is the entire quotation:
"The future of President Assad must be decided by the Syrian people. Now, I do not want to interfere in the process of Vienna, but I think it is totally unfair and unreasonable that the fate of a person [diplomatese here for: U.S. President Barack Obama’s demand that Assad be removed from the Presidency of Syria] to paralyze all this political negotiation. This is not acceptable. It's not fair. The Syrian government insists that Assad should be part of the transition. Many Western countries oppose the Syrian government’s position. Meanwhile, we lost years. 250,000 people have been killed. There are 13 million refugees or internally displaced. Over 50% of hospitals, schools and infrastructure has been destroyed in Syria. You must not lose more time. This crisis goes beyond Syria, beyond the region. It affects Europe. It is a global crisis.”The U.N. Secretary General is here implicitly blaming all of this – lots of blood and misery – on U.S. President Obama, and on the “many Western countries” who ally with him and have joined with him in demanding regime-change in Syria.
The position of Russia’s President Vladimir Putin has been, and is, to the exact contrary of Obama’s: namely, that only an election by the Syrian people can determine whom Syria’s President should be. The U.N. Secretary General is here agreeing with Putin, and rejecting Obama’s demand, that the matter be determined instead by non-Syrians, and by non-democratic means (which is basically like George W. Bush did in Iraq, and like Barack Obama did in Libya).
Suckers in the West fall for the Western aristocracies’ line that Putin and not Obama is wrong on this and is the cause of the dragged-out Syrian war. Such fools don’t even ask themselves whether in this dispute it is Obama, or instead Putin, who is supporting the most basic democratic principle of self-rule by the people. But the average individual is that manipulable: so manipulable as to think that black is white, and white is black; that good is bad, and bad is good. Totally manipulable.
This interview was buried by Spanish newspapers, because the Spanish government is allied with the United States. For example, the most prominent Spanish newspaper to publish even quotations from this interview is El Pais, and their headline for the story is "Catalonia is not among the territories with the right to self-determination.” Even there, the headline is false. What Moon actually said instead on that issue of the Catalonian independence movement, was: “The Catalan question is a very delicate matter and, while the UN Secretary General, I'm not in a position to comment on that because it is a purely internal matter.” Lies and distortions in the Western ‘news’ media are that routine: so obvious, sometimes, virtually any intelligent reader can easily recognize that he’s reading lies and propaganda (like in that ‘news’ story).
This newspaper actually buried the part about Assad and Obama (the blockbuster in the entire story) near the end, but not at the very end, of its report, because one of the standard things that ‘news’ media do if they want to de-emphasize a particular point is to bring the matter up near the end but not at the end. To place it at the end, would emphasize, instead of de-emphasize, the given point: it’s not the professional way to bury news. Knowledge of how to bury news is important for the managers of any ‘news’ medium, because such knowledge is essential in order to make the medium achieve the objectives of the medium’s owner, the propagandistic function, which is the main reason why wealthy people buy major ‘news’ media, and why major corporations chose to advertise in (and thereby subsidize) these media (which increases that given ‘news’ media-owner’s income).
As to why the managers (including editors) of El Pais wanted their ‘reporter’ to misrepresent Moon as being opposed to Catalan independence, the reason is that the owners of El Pais are opposed to Catalan independence. It’s not only in the editorials. With very few exceptions, a newspaper’s editorials and its ‘news’ reporting are slanted the same way. However, sometimes, for particular reasons, the editorial position is instead slanted the opposite way from the ‘news’ ‘reporting.’ Public relations, or PRopaganda, is a science, not for amateurs. And a major function of management is to apply that science so as to maximize value for the medium’s owners. It’s like any business, but the press is also part of the business of government: moulding the public’s opinions so as to serve the needs of the aristocracy that owns the vast majority of the nation’s wealth. The idea of ‘the free press’ is itself PRopaganda. In reality, the press is far from free.
Anyway, Ban ki-Moon took a rare courageous position here: what he said was correct, though it’s virtually unmentionable in the West. For example: how widely is this news-report being published? It was submitted to virtually all national news-media in the U.S. and several other Western countries. You can google the headline, “Ban Ki Moon Condemns the American Stand on Syria, Endorses Putin’s” to find out how many (and which ones) are actually publishing it.
 * * *Investigative historian Eric Zuesse is the author, most recently, of They’re Not Even Close: The Democratic vs. Republican Economic Records, 1910-2010, and of CHRIST’S VENTRILOQUISTS: The Event that Created Christianity.
- JPM Quants: The Catalyst For The October Rally Is Over; "All 4 Sectors Are Currently Long Equities"
When it comes to predicting the market’s turbulent swings over the late summer, JPM’s quant team has been absolutely phenomenal, with virtually every single call being absolutely spot on. We previously documented the best exampled as follows:
- August 21, just before the Black Monday flash crash: “Why The Market Is Crashing Into The Close: JPM Explains“
- August 27: “JPM Head Quant Warns Second Market Crash May Be Imminent: Violent Selling Could Return On Thursday“
- September 3, before the next leg lower in stocks: “Home JPM Head Quant Is Back With New Warning: “Only Half The Selling Is Done; Expect More Downside“”
But it was his final call, that from the end of September, that may have been the most monumental. We flagged it on September 24 as follows: “Bears Beware, JPM’s Head Quant Just Flipped To Bullish: “The Technical Buying Begins” and we noted that, according to JPM’s calculations, quants are about to unleash a major buying spree.
This is what happened after:

JPM was right. Again.
Where do we stand now? Here is the latest from JPM’s quant wizards:
Since September 29th, balanced mutual funds has been the best performing sector among the above four sectors returning almost 7%. They are followed by risk parity funds which are up by 3% and Discretionary Macro hedge funds which are up by 1%. CTAs are the worst performing sector returning a negative 2%. In other words, among the four sectors, CTAs are the ones suffering the most due to their short equity exposure, while balance mutual funds benefited the most from the equity rally due to high equity exposure. How high are these equity exposures currently?
Figure 2 shows the 21-day rolling betas to equities for balanced mutual funds.

This beta started rising sharply in mid September and by mid October it had surpassed the previous high for the year seen last June. The equity beta of balanced mutual funds currently stands at a very high level by historical standards, creating vulnerability for equity markets in the near term. Similar to balanced mutual funds, risk parity funds appear to have also increased their equity exposure sharply over the past month and their equity beta returned to levels last seen in early August (Figure 3).

The behavior of Discretionary Macro hedge funds and CTAs has been different. While Discretionary Macro hedge funds appear to have also raised their equity exposure over the past month, the rise was much less pronounced than that of either balanced mutual funds or risk parity funds. Their equity beta currently stands at a modest positive level and well below that of early August. CTAs, which had adopted a short position in equities from the beginning of August already, had increased their shorts in September and early October. But they appear to have capitulated in the middle of October, by not only cutting their equity shorts, but reversing and moving to a long position instead. This is shown more clearly in Figure 5 which shows both the 21-day and 10-day rolling equity beta of CTAs. The 10-day beta is a better reflection of the behavior of CTAs over the most recent couple of weeks, as it is not affected by observations during the first half of the month. This 10-day rolling equity beta shows an abrupt shift from a short to a long position in equities around the mid of the month. Indeed, while CTAs had suffered a loss of around 4% in the first two weeks of the month, they made a profit of 1% during the second half.
Putting it all together:
In all, while balanced mutual funds and risk parity funds are the ones which appear to have triggered the equity rally since the end of September, the rally was amplified at around mid October by CTA capitulation. The reversal of CTAs equity exposure from a short to a long position means that all four sectors, CTAs, Discretionary Macro hedge funds, risk parity funds and multi-asset or balanced mutual funds, are currently long equities.
In other words, the catalyst that unleashed the torrid October rally which culminated with the biggest point gain in the S&P500 in history, is now over. As for retail…
Retail investors appear to have had little participation in October’s equity rally with the exception of the end of the month, i.e. the week ending October 28th when their equity fund buying was more significant.
The two key points: the forced technical buying at the end of September, correctly predicted by JPM, is now gone, as “all four sectors, CTAs, Discretionary Macro hedge funds, risk parity funds and multi-asset or balanced mutual funds, are currently long equities.” This means that either the corporate buybacks go into overdrive and soak up the excess risk exposure which the technical buyers have on their books, or retail investors do.
If neither happens, expect another downside volatile month, especially if the market realizes that – as we reported earlier this morning – even the Fed’s own forecasting model now suggests slack in the economy is gone and the time to hike rates in December has arrived.


- "The Output Gap Appears Closed" – The Fed's Model Just Confirmed A December Rate Hike
Back on July 24, as we first wrote then, the 2 Year bond yield suddenly tumbled just before noon…

… when it was discovered that “accidentally” the Fed released its confidential, policy-driving economic projections, alongside its public forecasts, as calculated by the Federal Reserve’s FRB/US computer model.
These were far more dovish than most, at the time, expected and certainly far worse than the Fed’s public computer model data indicated. To wit: “While superficially, and as expected, the Fed is assuming a 1.26% fed funds rate in one year, suggesting about 3-4 rate hikes until then, with the first one according to the leaked documents taking place in Q3, the overall strength of the economy is well weaker, and thus more dovish, than many of the permabulls had expected.”
This led to a sharp repricing of both short-term rates and inflation expectations. Four months later we find that, at least one, the Fed’s model was right, ironically this happened when it had predicted a slowdown.
As a reminder, approximately every three months, Federal Reserve Board staff update and publish on the Board’s website a package of computer code of the Board staff’s FRB/US model of the U.S. economy, including a set of illustrative economic projections based only on publicly available information.
On June 29, an updated package of code was posted that inadvertently included three files containing staff economic forecasts that are confidential FOMC information. Two files contained charts of the staff’s projections for economic variables such as the unemployment rate, the core inflation rate, and gross domestic product growth as well as the staff’s assumption for the path of the federal funds rate target selected by the FOMC. Another file contained computer code used to generate a table displaying staff economic projections.
Three months after the July 24th fiasco, this Friday afternoon the Fed released an updated set of FRB/US outputs which this time may have precipitated the late day selloff as the results showed a vastly different picture than the one revealed in July. The model also may explain the unexpectedly hawkish tone in the Fed’s October statement.
In short: the model validated concerns that the Fed may hike rates in December because the Fed’s take, at least as modeled under Excel, is that the “slack in the US economy has substantively disappeared.” This is shown in the chart below which shows the dramatic divergence between the last and most recent FRB/US forecast on the US output gap.
To explain the chart above, Bloomberg cites Barclays’ chief US economist Michael Gapen (who previously worked at the Fed) who pored through the Fed model data, “the output gap appears closed. This means further progress would lead to resource scarcity and potential upward pressure on inflation in the medium term.”
Gapen said that may explain why U.S. central bankers signaled this week that they will consider the first interest-rate increase since 2006 at their next meeting, on Dec. 15-16. Finally, “the model assumes that the Federal Open Market Committee raises the benchmark lending rate in late 2015.”
Which leaves the one and only FOMC meeting left this year: that on December 15-16.
Some more details from the Barclays note:
According to the bank, “the updated output is consistent with near-term liftoff of the fed funds rate, with a risk toward a later liftoff should further softness in inflation manifest. The model now shows much less assumed cyclical slack in the economy and has a softer path of inflation, highlighting the FOMC’s current dilemma as the two parts of their objective move in opposite directions.”
Barclays ran the FRB/IS model using the most recent data, and had the following additional take-aways:
Figure 1: The fed funds rate: FRB/US now assumes that the FOMC increases the fed funds rate in late 2015. We see this lift off as consistent with a December rate hike. Of note, FRB/US, like all other state space or DSGE models of the economy, calls for an immediate and rapid liftoff of policy rates. This immediate lift off has been a feature of FRB/US output since late 2014. The models see most variables as close to their long-run levels and hence the model calls for a return of interest rates to their long-run level (in other words, models do not take into account latent headwinds such as financial frictions or credit constraints in the economy).
Of note, all variables in the model must converge to long-run levels imposed by staff. At least in the assumptions used for this public version of FRB/US, the staff sees the long-run level of the funds rate at 3.5%, down 25bp from their previous release. This estimate is still higher than our belief (3.0 to 3.25%) but has gradually converged toward our estimate. The staff’s current assumption is down from the 4% level assumed by the Board as recently as late last year.
Figure 1: Funds path consistent with December

Figure 2: The unemployment rate: The staff moved the long-run level of the unemployment rate (NAIRU) lower in the October 30 release of the model. At 4.9%, NAIRU is two-tenths lower than in the previous version of the model. The lower level of NAIRU is consistent with the views of the committee as expressed in the SEP. The SEP shows the long-run level of the unemployment rate at 4.9%. With unemployment currently at 5.1%, FRB/US assumes very little change in the unemployment rate over time. This view is quite different than ours. We forecast ongoing declines in the unemployment rate and see it reaching 4.3% by end 2016.
Not shown in the output of the model, the stability of the unemployment rate implies either an increase in the LFPR (labor force participation rate) or a sharp slowing in employment growth. According to our estimates holding LFPR constant, the level of employment growth that keeps the unemployment rate constant is 76k per month. Alternatively, an increase in LFPR of about 0.7pp would allow NAIRU to stabilize with employment growth near its recent average.
Figure 2: NAIRU pushed down to 4.9%

Figure 3: Core PCE inflation: The updated path for core PCE inflation closely matches our current forecast. In our forecast, the stabilization in oil prices should lead headline inflation to rebound early next year, but we look for recent dollar appreciation and ongoing declines in Chinese producer prices to lead to a moderation in tradable goods inflation through mid-2016. The release of September PCE inflation this morning is consistent with this view, as the sharp drag from goods prices (-3.2% y/y) led to an unchanged year-on-year rate of core inflation at 1.3%. The FRB/US model agrees and shows the firming in core inflation as giving way to a modest softening through mid-2016. As shown in Figure 3, the October 30 path shows a shallower path from Q1 16 through Q4 17 than the previous FRB/US update.
Figure 3: PCE inflation slightly lower

Figure 4: Real GDP growth: The October 30 update for FRBUS also shows a slower growth profile after this year and a lower long-run potential growth rate. As shown in Figure 4, the updated path has y/y rates of economic growth gradually slowing from 2.5% in Q1 16 to 2.1% in 2020. Based on FOMC communications, including minutes to recent FOMC meetings, we believe the shallower growth path likely reflects greater assumed dollar appreciation. In addition, the long-run growth rate is two-tenths lower than the previous FRB/US update (2.1% now versus 2.3% previously). Since this growth rate at the end of the horizon is imposed by staff, we interpret this as suggesting staff has likely reduced its estimate of potential growth, as did FOMC participants in the September forecast round.
Our view of potential growth is more pessimistic at about 1.5%, but our estimate is weighted heavily to current trends and is not equivalent to the Fed’s long-run estimate. Board staff have likely assumed that productivity growth, which has been much slower in the post-recession environment, rebounds over time as headwinds to the US economy dissipate. We do not discount this possibility, but leave this as an open question for the data to resolve over time.
Figure 4: Real GDP growth slows after this year

And the most important chart: The output gap: Board staff now see the output gap as closing by Q1 2016. To achieve this closing especially given their mark down of real GDP growth, they sharply lowered their estimate of potential growth in 2015. This change likely has policy implications as it indicates a staff view that there is no longer substantive slack in the US economy.
Figure 5: Potential output slashed to close output gap despite slower growth profile
* * *
Finally, just in case someone is skeptical that any of the above computer simulations just “might” be wrong, here is an example of the code that gives the Fed a better understanding of reality than reality itself.

As it turns out, everyone does live in the Matrix. The Fed’s “model” matrix that is, which at least to the Fed is far more important than the “reality” some 99% of the US population live in, those who never benefited from the Fed’s generous injection of $3 trilion in bank reserves.

- Stocks, Symmetry, & A Significant Threat To The Global Economy
Submitted by NorthmanTrader.com,
If you been following our technical chart segment you have seen the evolution of one particular chart: That of the daily $SPX. The rejection of price on Friday, after yet another push higher, occurred at the level of an arch that we have been observing unfold over the past year. Now there is no technical pattern called the “arch”, but one cannot deny that since September 2014 price rejections have taken place along very specific points that now offer stunning symmetry.
It is not only the arch here which has proved superbly precise, but the confluences of price rejections are incredible.
Consider:
September 2014: 2019.25 September 2015: 2020.32
December 2014: 2093.55 October 2015: 2094.32:
Coincidence? Hardly:
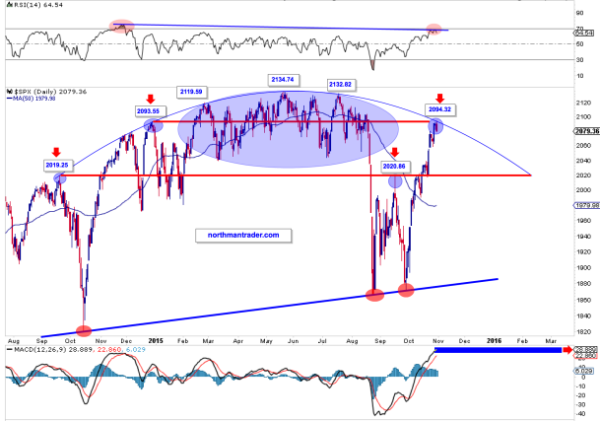
One can’t help but wonder if all of January – July 2015 was simply the building of a giant head.
Consider also that the MACD is at its most extended since the year 2000 top and the RSI actually made a lower high versus the December 2014 2093.55 peak. Also of note is that the $SPX is the furthest disconnected from its 50MA to the upside in years.
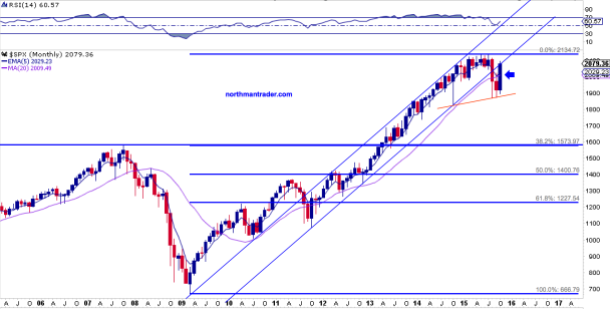
Taking these facts into consideration, especially in context of the weekly and monthly charts we’ve been highlighting, the potential for a giant heads and shoulders pattern remains fully in play.
What will break the pattern? Likely a decisive and confirmed close above 2094 on a weekly basis and/or new highs.
What will confirm the pattern? New lows and a break of the lower neckline.
The target? Depending on how you define the neckline (were it to break) it invites a visit back to 2007 highs. Yes the pattern is indeed this large:
That would be a drop of over 25%. A very steep correction into 2016 and something that central banks are clearly desperate to avoid. Central banks, as academia, know the truth:
“It is unclear whether the sell-off is over or has slightly paused; in the latter case we could be headed for a potentially very serious equity slump by historic standards,” economists Adam Slater and Melanie Rama said in their report. “A sharp correction in global equity prices would pose a significant threat to the global economy. By reducing wealth, Oxford’s economic models suggest a 15 percent drop in the MSCI could cut the level of world gross domestic product by as much as 0.7 percent after two years. A 30 percent shock would knock off as much as 1.5 percent.”
Central banks can’t afford a big correction to take place as it goes counter to their mandate, a stable growing economy, hence they interfere every single time a correction of size is about to unfold. And any threat to the global economy must be prevented. So it’s no accident that we have seen all price expansion since $SPX 2020 in October come on the heels of Mario Draghi hinting at additional QE coming in December and the PBOC cutting rates just a day later. Now that fiscal year end mark-ups are over for many funds buyers have to prove how committed they are to driving markets higher.
Price will ultimately confirm how this will play out, but altogether this $SPX chart is an amazing construct of symmetry and, as a fan of structures and symmetry, it certainly has my attention. I can’t recall ever seeing such a precise structure.

- Iraq Turns On America: “Iraqi People Have Started To Feel That The US Isn't Serious About Fighting ISIS"
If you frequent these pages, you’re well aware of why the US decided to release helmet cam footage of a raid on an ISIS prison in the northern Iraqi town of Huwija.
Put simply, Baghdad has had just about enough of Washington’s “strategy” for fighting terror in the country and when PM Haider al-Abadi said he would welcome Russian airstrikes, the US panicked. Rather than try to recount the story by paraphrasing ourselves, we’ll simply include our most succinct summary of what exactly is going on in Iraq, originally published here:
Perhaps the most astounding thing about recent events in the Mid-East is the extent to which outcomes that seem far-fetched one week become reality the next.
This dynamic began back in June when Iran’s most powerful general vowed to “surprise the world” with his next move in Syria. Just weeks later, he was in Moscow (in violation of a UN travel ban) hatching a plan with Putin to launch an all-out invasion on behalf of Assad on the way to forcibly enacting a dramatic shift in the Mid-East balance of power. Before the West had a chance to react, Moscow was establishing an air base at Latakia.
As all of this unfolded we began to suggest that it would be only a matter of time before Russian airstrikes began in Iraq.
The setup, we contended, was just too perfect. Iran controls both the military and politics in the country and so, we speculated that The Kremlin would get a warm welcome if Putin decided to launch an air campaign against ISIS targets across Syria’s eastern border.
Sure enough, Baghdad moved to establish an intelligence cell with Russia, Syria, and Iran in September and when PM Haider al-Abadi said he would welcome Russian airstrikes, it was clear that the US was about to be booted out of the country it “liberated” more than a decade ago.
Subsequently, Joint Chiefs of Staff Gen. Joe Dunford traveled to Baghdad and gave Abadi an ultimatum: “…it’s either us or the Russians.”
Well, despite Dunford’s contention that Abadi promised not to enlist Moscow’s help, just days later Iraq gave Moscow the green light to strike ISIS convoys fleeing Syria.
A desperate Washington then attempted to prove that the US could still be effective at fighting terrorism by sending 30 Delta Force soldiers into battle with the Peshmerga on a prison raid mission in the Northern Iraqi town of Huwija. Conveniently, one American soldier apparently had a GoPro strapped to his helmet and the footage was almost immediately leaked to Western media.
Washington apparently assumed that the successful raid would be enough to restore the faith because the Pentagon immediately began to formulate a “plan” to send Apache gunships and their crews to Baghdad. In what has to be considered one of the more embarrassing moments in a string of setbacks for America’s Mid-East “strategy,” Baghdad flat out told the US “thanks, but no thanks”:
“This is an Iraqi affair and the government did not ask the U.S. Department of Defense to be involved in direct operations,” spokesman Sa’ad al-Hadithi told NBC News. “We have enough soldiers on the ground.”
The White House kind of brushed that off and moved on to talking about spec ops in Syria, but the implication is that if the US plans on getting more heavily involved in combat operations in Iraq, Washington will have to do so through Erbil, not through Baghdad.
This all comes on the heels of a push by Iraqi forces and Iran-backed militias to retake a key oil refinery at Baiji from Islamic State. That battle underscored the extent to which Tehran essentially controls the Iraqi army (not to mention Iraqi politics). Consider the following brief excert from The NY Times:
“A spokesman for Shiite militias said that several thousand Shiite militiamen were fighting in and near Baiji, which is more than the estimated number of Iraqi soldiers also fighting there.”
As regular readers know, this is no conspiracy theory. It’s common knowledge among those who study the region that Iran’s militias are more powerful than the Iraqi regulars and the Quds Force essentially controls the political process in Baghdad. You can read more about this here, here, and here.
This creates a rather tenuous situation for Washington. The US must maintain a kind of loose alliance with the Shiite militias in Iraq lest the Pentagon should be forced to explain to the public why America doesn’t support groups that are very effectively fighting ISIS. But there are two problems with that: i) it’s not entirely clear that the US wants to rid Iraq and Syria of ISIS and you can bet the IRGC is whispering that in the ears of every Shiite politician in Baghdad, and ii) these very same Shiite militias are fighting the Assad regime at Aleppo where the US is supplying anti-tank weapons to Sunni extremists.
Well, just as the Western public is beginning to realize that something rather fishy is going on in Syria, Iraqis are throwing in the towel on the US “effort” to rid the country of Islamic State fighters. Here’s WSJ with more on how the locals feel in the wake of the assault on the Baiji refinery:
A big victory over Islamic State here provided fresh ammunition for the many Iraqi Shiites who prefer Iran as a battlefield partner over the U.S., despite indications that Washington could soon intensify its battle against the extremist militants.
Shiite militias and politicians backed by Iran have claimed much of the credit for the Iraqi recapture a little over a week ago of the city and oil refinery of Beiji, about 130 miles north of Baghdad. Militia fighters danced and posed for pictures on tanks and armored cars near the bombed-out shell of the massive refinery there, Iraq’s largest.
Powerful Iraqi politicians and militia leaders have cited the yearlong operation to retake the city as evidence that Iraqis can combat Islamic State alone—or with help only of the Iran-backed militias. Some are now lobbying Prime Minister Haider al-Abadi to rely less on the U.S.-led coalition battling Islamic State and more on the PMF.
“Iraqi people in general, not only us, have started to feel that the Americans are not serious at all about the fight against Islamic State,” said Moeen Al- Kadhimi, a spokesman for the Iran-backed Badr Corps militia. “Every victory that the PMF does without the help of the Americans is a big embarrassment for the Americans.”
For those who might have missed it, here are images from the fight which depict Iran’s proxy armies on the scene at Baiji:


Of course rather than simply take the high road and consent that regardless of who was ultimately responsible for taking back the refinery, it was a step in the right direction, Washington has decided to deride Iran’s militias for absolutely no reason at all. Back to WSJ:
U.S. officers say the Iran-backed proxy militias known as Popular Mobilization Forces, or PMF, played only a supporting role. The bulk of the fighting was by Iraqi federal police and elite counterterrorism units trained by the U.S., the American officers said.
“It’s easy to say after the fact that ‘we did this,’ ” said Maj. Michael Filanowski, an officer for the Combined Joint Task Force, which organizes operations of the U.S.-led coalition. “But if you look at the sequence of events, it was Iraqi security forces that did the assault operations.”
He called the militias a “hold force,” meaning they secured the territory after it fell to the Iraqi forces.
So let’s just be clear. Either, i) the US is so petty that the Pentagon is willing to argue over who played a larger role in retaking Iraq’s largest oil refinery from ISIS, or ii) Washington is actually angry that ISIS was defeated and is thus lashing out at Tehran.
Whatever the case, it’s too late. The game is up for the US in Iraq:
On Monday, Ali Adeeb, head of the State of Law bloc that controls the ruling coalition in parliament, called on Iraq’s government to prevent the U.S. from launching further ground operations like the prison raid.
Meanwhile, pro-Iranian Iraqi politicians are pointing to a grinding U.S.-led effort to retake Ramadi, the capital of Anbar province about 65 miles west of the capital, as evidence the U.S. isn’t doing enough to defeat Islamic State.
For some Shiite politicians, Ramadi and Beiji epitomize the diverging fortunes of U.S. and Iran in Iraq.
“The two operations in those two cities represent the competition between the U.S.-led coalition and the newly formed alliance among Russia, Iran and Iraq,” said Hakim al-Zamili, a prominent Shiite politician and head of the security and defense committee in parliament.
The battlefield succic State, said Patrick Martin, an Iraq analyst at the Washington-based Institute for the Study of War.
[Reports”] in Beiji will also make it harder for the prime minister to refuse entreaties for more support from Russia in the fight against Islam
“Russia and Iran have very similar objectives in that they both want to eject U.S. influence from Iraq,” said Mr. Martin. “Any success that the militias have bolsters that goal.”
There are two critical takeaways here. First (and we’ve said this repeatedly) these are the very same Shiite militias battling US-backed Sunni fighters in Syria. Second, this is but another example of Washington siding with Sunni extremists over Tehran. This is a replay of what happened in the wake of 9/11 when Iran sought to help the US target the Taliban and al-Qaeda only to see The White House place Tehran in its “Axis Of Evil.” Here again, we have Sunni militants terrorizing both Syria and Iraq and instead of working with the Iranians to oust those extremists, Washington is busy downplaying their successes and supporting the proxy armies of Saudi Arabia and Qatar even as those proxy armies behead Westerners and burn Jordanian pilots alive.
This is a travesty and an absolute farce.
The US is on the wrong side of history here and it’s too late to correct it.

- "Social Expenditures" In the US Are Higher Than All Other OECD Countries, Except France
Submitted by Ryan McMaken via The Mises Institute,
According to the Organization of Economic Cooperation and Development (OECD), "social expenditures" are expenditures that occur with the purpose of redistributing resources from one group to another, in order to benefit a lower-income or presumably disadvantaged population.
Social Security in the US is one example, and would be considered a "public expenditure" because it involves direct spending by a government agency.
However, governmental bodies in the US and elsewhere also employ a wide array of mandates and tax-based benefits and incentives to carry out social policy. This distinguishes the US in particular from most European countries that rely more on cash benefits or non-cash benefits administered directly by governments.
But governments are not limited to direct benefits. Governments may also employ "tax breaks for social purposes" (TBSPs) including tax credits for child care, and tax breaks for health-care related spending.
Furthermore, in the United States — more so than in other countries — governments create tax incentives and mandates that lead to high levels of "private social expenditure." The OECD defines these private expenditures as expenditures that are designed to redistribute wealth, but are not administered directly by government agencies:
Mandatory private social expenditure: social support stipulated by legislation but operated through the private sector , e. g. direct sickness payments by employers to their absent employees as legislated by public authorities, or benefits accruing from mandatory contributions to private insurance funds.
Voluntary private social expenditure: benefits accruing from privately operated programmes that involve the redistribution of resources across households and include benefits provided by NGOs, and benefit accruing from tax advantaged individual plans and collective (often employment – related ) support arrangements , such as for example, pensions, childcare support, and, in the US, employment – related health plans
The focus on direct government spending, however, creates the impression that the US does not engage in the business of redistributing wealth to the degree of other OECD-type countries. But this is not the case. When we consider tax incentives, benefits, and mandates, the picture is very different.
When just measuring direct government spending as a percentage of GDP, the US ranks fairly low. Note however, that even in this case, the US ranks above both Australia and Canada, two countries that are rarely accused of being excessively capitalist:

Direct social spending by government constitutes 18.6 percent of GDP in the US. In Australia, the total is 16.9 percent, and in Canada, it is 16.3 percent. France tops the list with 29.4 percent.
But this just captures spending by government entities. When we look at other types of spending that result from tax incentives and mandates, things look different.
Once tax breaks for social purposes (TBSPs) are included, the US begins to look much more similar to its European counterparts. By this measure, the US falls in the middle, with more net social spending (as a percentage of GDP) than New Zealand, Norway, Luxembourg, Australia, and Canada:

By this measure, social spending constitutes 20.1 percent in the US, compared to 17.4 percent in Australia and 15.3 percent in Canada. Luxembourg is 18.0 percent and Norway is 18.1 percent. France, again, tops the list with 27.9 percent.
These tax breaks have the effect of encouraging "private" social expenditures as well, including health care spending (for example).
Once these "private" sources of social spending are included, we find that the US spends the most by far. We should note also that these figures, from 2011, predate the enactment of "Obamacare," and do not reflect what will likely entail far greater amounts of private social social expenditure on health care.
In this measure, private social spending comes in at 10.1 percent which is almost twice as much as the next big private spender, the Netherlands, at 5.2 percent. The United Kingdom comes in third at 4.8 percent:

So, once we take this into account, we get what the OECD calls "net total social expenditure." It is, of course, deceptive to ignore social expenditures that take a form other than cash transfers and transactions with government agencies. After all, numerous countries other than the US employ legislation (including tax law) to incentivize or mandate social spending with the specific purpose of providing benefits or advantages to certain households.The resulting analysis looks like this:

In the US, net total social expenditures amount to 28.7 percent of GDP. Only France shows a higher rate than this with 31.2 percent. Belgium comes in third at 27.4 percent.
Conclusions
There are a few things we can learn from this analysis. First of all, it is important to note that the US does not redistribute resources any less than other countries. Like most other "developed" countries, the US employs a wide variety of public policies to benefit certain groups and income levels.
Additionally, when taken together, the expenditures that result from these public policies are sizable, and even exceed nearly all other countries measured.
Left-wing pundits and scholars who wish to portray the US as a kind of hyper-capitalist social-Darwinist system conveniently focus on direct cash transfers and social spending by government agencies while ignoring other sources of social expenditures. At the same time, conservatives and right wing pundits, for different reasons, often attempt to portray the US government as a regime that engages in less redistribution of wealth than other states. Both groups are mistaken.
Whether or not the policies employed in the US have had the effect preferred by advocates of more social spending is a separate matter from the amount spent overall. We cannot honestly say that the US is some sort of outlier when the US clearly engages in social expenditures in proportions that rival multiple states in Western and Northern Europe.
Nor should we ignore the fact that the the redistributive policies employed by the US lead to just as many distortions to the economy as does the direct social spending favored by European governments. Tax breaks for homeowners, for example, create incentives for buying homes which distorts real estate markets while increasing the relative tax burden on renters. Tax incentives that encourage more spending on health care drive up health care prices. And so on. And of course, the US employs a wide variety of direct spending and subsidy schemes that create distortions of their own, including Social Security, Medicaid, "Section 8," and others.
Ultimately, we are forced to conclude that redistributive social spending in the US is indeed different from many other countries. But the overall magnitude is actually greater (both proportionally and in absolute terms) in the US than in almost all other countries measured. One can argue that the way that the wealth is redistributed through public policy in the US is "wrong" or "suboptimal." But, to argue that there is less redistribution as a result of public policy in the US than elsewhere is simply wrong.

- $20 Trillion In Government Bonds Yield Under 1%: The Stunning Facts How We Got There
Last week we wrote that in the latest bout of European NIRP panic, “Over Half Of European 2-Year Bonds Trade At Record Negative Yields” with Italy now paid to issue debt, with a follow-up in which even very serious banks are now looking at the Eurozone’s record €2.6 trillion in negative-yielding debt, and finding that the lower yields drop, the greater the savings rates across the continent…

… suggesting a “policy failure” as even more cash ends up inert on bank balance sheets instead of being spent on either the economy or asset price inflation.
And while the €2.6 trillion number noted above is massive, and as we showed last week is a record for the amount of debt trading under negative rates in Europe…

… here are some shocking statistics on how we got there, and which we all take for granted, courtesy of BofA:
- There have been 606 global rate cuts since LEH
- $12.4 trillion of central bank asset purchases (QE) since Bear Stearns
- The Fed is operating a zero rate policy for the longest period ever (even exceeding the WW2 Aug’37-Sep’42 zero rate period)
- European central banks operating negative rate policies (Swiss policy rate currently -0.75%; Sweden’s policy rate currently -0.35
- Just this month, the PBoC cut rates, the ECB confirmed QE2, Sweden announced additional QE, and the BoJ promised additional easing if necessary “without hesitation”
- $6.3 trillion global government bonds currently yielding <0%
- $20.0 trillion global government bonds currently yielding <1%
But wait, there’s more in describing what BofA says is the most immense and long-lasting monetary stimulus, i.e., bubble, in history:
- For every 1 job created in the US this decade, US corporations have spent $296,000 on stock buybacks
- An investment of $100 in a portfolio of global stocks & bonds (60:40) since the onset of QE1 would now be worth $205; in contrast, a wage of $100 has risen to just $114 over the same period
- US prime (“CBD”) office real estate has appreciated 168% this decade; in contrast, the value of US residential property across America has risen just 16% (see Chart 5)

- For every $100 US venture capital & private equity funds raised Jan 1st 2010 they are now raising $275; in contrast, for every $100 of US mortgage credit extended and accepted at the beginning of this decade, just $61 was extended and accepted in June 2015 (see Chart 6 – a big reason the US consumer remains so moribund)

- In 2014 London accounted for 26% of the value of all housing sales in England, despite accounting for just 1% of the land area
And so on.
What can end this wholesale lunacy which only economists fail to grasp for what it is: the biggest global asset bubble in the history of humanity, leading to a monetary ice age across the world’s economies (as the velocity of money drops to zero or goes negative) which as Albert Edwards so aptly predicted years ago, is the natural counter to asset price hyperinflation? Alas, with all central banks now clearly all-in on the last and final attempt to reflate the world’s $200+ trillion in debt (a default is not an option as it would wipe out tens of trillions in “legacy” equity wealth) expect many more exponential charts in the coming months before the inevitable admission of “policy failure” by central planners which, if past is prologue, will come during the sound of guns.


Digest powered by RSS Digest
 Saving...