
- On Campus Of 30,000 Students, Less Than 10 Attend University’s White Privilege Workshop
On Campus Of 30,000 Students, Less Than 10 Attend University’s White Privilege Workshop
Submitted by Emma Schambach of The College Fix
Only nine students showed up to take part in the University of North Carolina at Charlotte’s workshop series focused on teaching students about white privilege and related topics. The total number of students in the audience for the first “White Consciousness Conversation,” held Sept. 10, was nine — but two were students there not as participants but as journalists mainly to observe. One was from The College Fix and another from the Niner Times campus newspaper.
Of the remaining seven students, five are members of the university’s conservative Young Americans for Freedom chapter, who were there more out of curiosity and concern about the nature of the seminar and its taxpayer-funded narrative as opposed to learning about how they allegedly perpetuate racism and inequality as Americans with white skin.
Finally, the other two students attended because their professors offered them extra credit to do so, they told The Fix.
With that, it appears the relatively new “White Consciousness Conversations” at UNC Charlotte, which boasts a student population of nearly 30,000, drew .02 percent of its student population.
Facilitators of the workshop did not respond to a subsequent request for comment from The College Fix about what they thought of the event’s low turnout.
According to the university’s website, the conversations aim to help students understand “the meaning and implications of whiteness” and how “engaging in anti-racist practice is crucial in creating racial equity.”
“This space is for all undergraduate and graduate students at UNC Charlotte who are interested in engaging in conversations to assist in their understanding of how racism is perpetuated individually, culturally, and systemically,” the website states.
The workshops first made national headlines in fall 2018 after they were advertised as only for white people. After backlash, campus leaders scrubbed and reworded the original advertisements. But the national attention, and the progressive focus of the workshops, is what drew members of YAF to the Sept. 10 workshop — as opposed to the notion that they agree with the narrative. (The author of this piece is also a member of YAF.)
Several students said they were open to hearing new perspectives, but also wanted to voice our own opinions on the matter.
The two-hour meeting was led by two campus diversity facilitators who spoke on topics such as feminism, white privilege, toxic masculinity and LGBTQ equality, and outlined their own definition of racism, one that claims that while racial discrimination can be targeted at anyone, by anyone, racism itself stems inherently from white people and their “whiteness.”
At the end of the workshop, at least two conservative students said the information presented seemed focused on blaming white people and whiteness for racism.
“I went into the event with an open mind, I wanted to learn what my peers thought about how the concept of whiteness ties into racism, whether or not it is an issue on our campus, and how we, as students, can create change if it was necessary,” YAF member Kelly VonEnde told The College Fix.
“I understand that racism is the dicrimination against someone based on their race. I believe that a person of any race can be discriminatory towards a person of any other race and that it would be considered racism. However, I was told that my definition better described as racial discrimination and that racism … can only flow from ‘whiteness’ and its inherent power. This definition made me feel as if I was in the wrong for simply being myself and accepting the body I was born with.”
“I think the creators of this event had good intentions, but … we had two different definitions of racism. Unfortunately, if we can’t agree on the definition of racism then we can’t make any meaningful steps towards productive change,” VonEnde said.
YAF member Cameron Smith echoed a similar sentiment.
He said the statements from the facilitators were vague and contradictory and “attempted to distort evidence in order to advance a specific narrative.”
“University-sponsored events like these are deeply concerning,” he said, “especially when some students who aren’t as politically active may hear one-sided theories, which are divisive without being shown any plausible solutions to their proposed issue of racial tension on campus.”
Tyler Durden
Sat, 09/21/2019 – 23:15 - These Are The Banks Where The Fed's $1.4 Trillion In Reserves Are Parked
These Are The Banks Where The Fed’s $1.4 Trillion In Reserves Are Parked
Over the past few days there has been much confusion over the repocalpyse that shook the overnight funding market, and just as much confusion over the definition of reserves which some banks were unwilling to part with, other banks were desperate for, and in the end both Powell and the former head of the NY Fed’s markets desk admitted that Quantitative Tightening had been taken too far, and the total amount of reserves in the system was too low and will be increased (welcome back QE).
Yet while the book has yet to be written on the causes for last week’s shocking move higher in repo rates, which sent general collateral as high as 10%, a record print in a time of $1.4 trillion in excess reserves, we can shed some clarity on the definition of “reserves.” While there is a universe of semantic gymnastics when it comes to explaining what reserves are, the most basic definition is quite simply “cash”, however not cash in circulation but rather cash (and deposits) held in the bank’s account with the Federal Reserve (which the US central bank’s name comes from).
This means that there should be a de facto identity between the total amount of cash in the US banking system and the amount of total (minimum required plus excess) reserves. Sure enough, if only looks at the Fed’s weekly H.8 statement, which lists the “Assets and Liabilities of Commercial Banks in the United States“, and adds across the various banking cash aggregates in the US, what one gets is precisely the total amount of reserves.
This is seen in the chart below, which adds across the weekly cash for both small and large domestic commercial banks operating in the US (blue and red shaded areas) as well as foreign commercial banks (yellow shaded) operating in the US. The black line, meanwhile, shows the total amount of reserve balances with Federal Reserve Banks. By definition these two numbers have to be virtually identical, and sure enough, they are.
Why is the above important?
Because as the FT reported on Friday as part of its interview with the NY Fed’s new, hapless and confused career-economist president, John Williams (who back in May inexplicably fired the man most intimately familiar with the plumbing of the US financial system, the NY Fed’s market desk head Simon Potter), the NY Fed president said that it was “looking at why cash failed to move from banks’ accounts at the Fed into the repo market, where banks and investors borrow money in exchange for Treasuries to cover short-term funding needs.“
Additionally, as Lorie Logan, senior vice-president in the markets group told the FT, “Reserves are concentrated, the excess reserves relative to the minimum level each bank is demanding is concentrated. And the key question is how those reserves, as the level was coming down, would get redistributed, and how smooth that redistribution process would be.”
In short, the NY Fed is looking at the banks that comprise the three aggregate levels above, and is trying to figure out why they did not hand out their cash to other banks that were in desperate need for liquidity, and why said reserves were so “concentrated”, i.e., sticky, so as to precipitate a funding crisis which was only halted when the Fed stepped in.
Alas, John Williams did not elaborate, so we will do so for him: the Fed is not only trying to figure out why banks with excess cash/reserves parked at the Fed did not offer it to their more liquidity-challenged peers, but why they refused to do so even though any such loan would be perfectly collateralized by money-good securities such as Treasuries, MBS and Agency debt and they refused to do it when repo rates had soared as high as 10%, an unprecedented arb to the Fed’s interest rate target range.
One possible explanation: the banks that should have lent out cash did not do so because they were afraid that i) the borrower would not be able to return the cash on the next day and ii) any potential failure in the banking system would lead to a collapse of the repo system, potentially making their ultra-safe collateral, impaired if not worthless. Hence, their desire to hold on to cash… and dear life.
In any event, if Williams really wants to find out why banks failed to step in and prevent last week’s repocalypse, he should start with the banks that are laid out in the chart above- and maybe he should focus first and foremost on the foreign banks that currently have $521 billion in cash parked at the Fed, on which they – the foreign banks – are collecting 1.80% in annual interest.
And once the NY Fed is done with this exercise, it may want to quickly found out the flip side of the equation: which banks were so desperate for liquidity last week they not only risked being seen using the Fed’s overnight repo operation, which in this day and age of $1.4 trillion in excess reserves carries the same stigma as using the Discount Window in the days before the Lehman failure, but did so by oversubscribing the Fed’s $75 billion repo facility for 3 days straight. In short, one or more banks are in dire need of just over $75 billion in liquidity, and the Fed better figure out who they are… before some financial reporter does, prints their name for the whole world to see and starts what may soon be the biggest bank run since the financial crisis.
Tyler Durden
Sat, 09/21/2019 – 22:48 - North America's Bird Population Is Collapsing – Nearly 3 Billion Wiped Out Since 1970
North America’s Bird Population Is Collapsing – Nearly 3 Billion Wiped Out Since 1970
Authored by Michael Snyder via The Economic Collapse blog,
All around us, our world is literally in a state of collapse, but most people don’t seem to care. I spend much of my time writing about the inevitable collapse of our economic and financial systems, but they are only one part of the story.
These days, millions upon millions of us are spending countless hours in this “virtual world” that we have created, and that is preventing many of us from understanding what is really going on in “the real world”. Where I live, I can literally keep the doors wide open for hours without worrying about bugs coming in, because insect populations are disappearing at a pace that is frightening. They are calling it “the insect apocalypse”, and some scientists are warning that they could all be gone in 100 years. And this dramatic decline in the insect population is one of the main reasons why North America’s bird population is collapsing. In the old days, I remember the singing of birds often greeting me in the morning, but these days I am never awakened by birds. That might make sense if I lived right in the middle of a major city, but I don’t. I live in a very rural location, and I do see birds out here, but not nearly as many as I would expect.
Sadly, the scientific evidence is confirming what many of us had feared. According to a scientific study that was just released, North America’s bird population has fallen by “nearly 3 billion birds since 1970″…
If you’ve noticed fewer birds in your backyard than you used to, you’re not mistaken.
North America has lost nearly 3 billion birds since 1970, a study said Thursday, which also found significant population declines among hundreds of bird species, including those once considered plentiful.
On second thought, I don’t know if the term “collapse” is strong enough to describe what we are facing.
In 1970, there were about 10 billion birds in North America.
Now, there are about 7 billion.
When are we finally going to admit that we have a major crisis on our hands?
Hopefully it will be before the count gets to zero.
Overall, we are talking about a total decline of approximately 30 percent…
“We saw this tremendous net loss across the entire bird community,” says Ken Rosenberg, an applied conservation scientist at the Cornell Lab of Ornithology in Ithaca, N.Y. “By our estimates, it’s a 30% loss in the total number of breeding birds.”
Could humanity survive without birds?
Probably, but this is yet another sign that the planetary food chain is in the process of totally breaking down. Despite all of our advanced technology, we are not going to survive without an environment that supports life, and at this moment that environment is being destroyed at a staggering pace.
According to the lead author of the study, the evidence they compiled “showed pervasive losses among common birds across all habitats, including backyard birds”…
“Multiple, independent lines of evidence show a massive reduction in the abundance of birds,” said study lead author Ken Rosenberg, a senior scientist at the Cornell Lab of Ornithology and American Bird Conservancy, in a statement. “We expected to see continuing declines of threatened species. But for the first time, the results also showed pervasive losses among common birds across all habitats, including backyard birds.”
I like having birds in my backyard. In fact, I wish that I had a whole lot more.
Two of the largest factors being blamed for this stunning decline are “toxic pesticides” and “insect decline”. We have already talked about the “insect apocalypse” which is raging all around us, but I should say a few words about pesticides. Yes, they may help to protect our crops and our lawns, but in the process we are literally poisoning everything.
And that includes ourselves. According to the Centers for Disease Control and Prevention, “there are traces of 29 different pesticides in the average American’s body”, and many believe that this is one of the reasons why cancer rates have skyrocketed in recent decades.
These days it seems like just about everyone knows at least one person with cancer. If you are one of those rare people that doesn’t know a single person with cancer, please leave a comment below, because I would love to hear your story. It has been estimated that one out of every three women and one out of every two men will get cancer in their lifetimes, but considering the rate that we are currently polluting our environment those estimates may be too conservative.
Without a doubt, several of the big pesticide companies are some of the most evil corporations on the entire planet, and yet most Americans don’t really seem to care about the death and destruction that they have unleashed all around us.
As with so many other things, this is yet another example that shows that we have no future on the path that we are currently on, and the clock is ticking.
Don’t you want a world in which the birds sing to you in the morning? Pete Marra, one of the scientists involved in the study, told the press that a number of bird species “that were very common when I was a kid” are among those being hit the hardest…
“We can all talk through the stories about there being fewer and fewer birds, but it’s not until you really put the numbers on it that you can really grasp the magnitude of these results,” Marra said. “We’re now seeing common species that have declined, things like red-winged blackbirds and grackles and meadowlarks — species that I grew up with, that were very common when I was a kid. That is the most surprising and most disturbing part.”
Everywhere around us, we can see decay, decline or collapse. This stunning drop in the bird population is just one more example.
But just like with so many other issues, most people don’t really care, and most people certainly don’t want to change.
So in the end we will reap what we have sown, and it will not be pleasant.
Tyler Durden
Sat, 09/21/2019 – 22:45 - Deja Vu 2000 Or Flashback 2007? (Part 2)
Deja Vu 2000 Or Flashback 2007? (Part 2)
Authored by David Hay via Evergreen Gavekal blog, Read Part 1 here
“The experience in Japan, Europe, or even the US, is that once you get into a near-zero interest-rate regime, it’s kind of a black hole. The economy tends to be pulled in, and once there, it’s difficult to escape.” – Larry Summers, former US Secretary of the Treasury.
“The US economy is in far worse shape than the Q2 GDP data suggest. Only the consumer is preventing a recession at the moment, and that is only happening because of stepped-up credit usage and a corresponding dip in the savings rate.” – David Rosenberg.
“The best signal of a recession is not an inverted yield curve. It’s the inversion occurring and then going away.” – DoubleLine Funds lead portfolio manager, Jeffrey Gundlach
SUMMARY
-
Evidence, such as the yield curve inversion, is mounting that later this year, or in the first half of 2020, the US could find itself in the midst of a recession.
-
However, it’s fair to note that not all US recession indicator warnings are lit up.
-
The planet’s banks are facing a trifecta of troubles from zero and sub-zero rates, generally inverted yield curves, and tight credit spreads.
-
The eradication of interest rates is also the kiss of death for insurance companies, pension plans, and retired investors.
-
In our view, a window of opportunity has opened up with certain high-yield equities that are in out-of-favor industries.
DÉJÀ VU 2000 OR FLASHBACK 2007? (PART II)
Let’s return to one of the most pressing questions facing investors right now, one we also discussed last week: Namely, how probable is a recession this year or next? The renowned David Rosenberg, who was one of the handful of economists to predict the 2007 downturn, thinks the US may be in one now. Evergreen doubts that, but the evidence is mounting that perhaps later this year, or in the first half of 2020, we could be in the midst of one (a topic I’ll return to at the close of this “Bubble 3.0” chapter).
Moreover, just this week the man considered the new King of Bonds, Jeff Gundlach, made the bold call that he believes there is a 75% chance of a US recession prior to next year’s presidential election. This is despite a growing chorus in the financial media lately singing the tune that the global economy is reviving. (Presumably, per his quote at the top of page 1, the reason he believes an “un-inversion” is problematic is that these happen when the Fed is panicking and furiously cutting rates to stave off a recession.)
Again, returning to the inversion of the yield curve, a striking aspect is how virtually the entire curve is flipped, which is a rare occurrence. As David Rosenberg wrote two weeks ago in his daily Breakfast with Dave (a must read, in my opinion, for any serious investor), the Fed pays the most attention to the 3-month T-bill versus the 10-year T-note. As well they should; when that has stayed inverted for at least three straight months, a recession has occurred 100% of the time. Guess what just happened?
As David wrote on August 26th, “When it (the curve) was only flattening a year ago, the bulls said ‘it’ll never invert.’ When it began to, the bulls said “only 2s/10s matter.’* When that inverted, the bulls said, ‘it’s different this time’. Good grief.”
Senior Fed officials have been right in there with the no-worries consensus on the inverted yield curve but at least one of them is breaking with their complacent ranks. St. Louis Fed-head James Bullard recently insisted that our central bank’s main priority should be normalizing the yield curve. He added that he has no interest in hearing any of his colleagues’ rationalizations about why this time is different, perhaps because he’s laser-focused on the chart above showing the 3-month/10-year inversion.
As David Rosenberg further wrote in his 8/26 Breakfast with Dave missive, “…the reality is that it is a very rare circumstance when the ENTIRE yield curve is inverted from the Fed funds to the 30-year Treasury bond…So we have 50 years’ worth of data and nine periods where the entire yield curve…inverted. I’m sure it’s always different to some, but of these nine episodes (where a full inversion occurred), we had eight recessions to follow.”
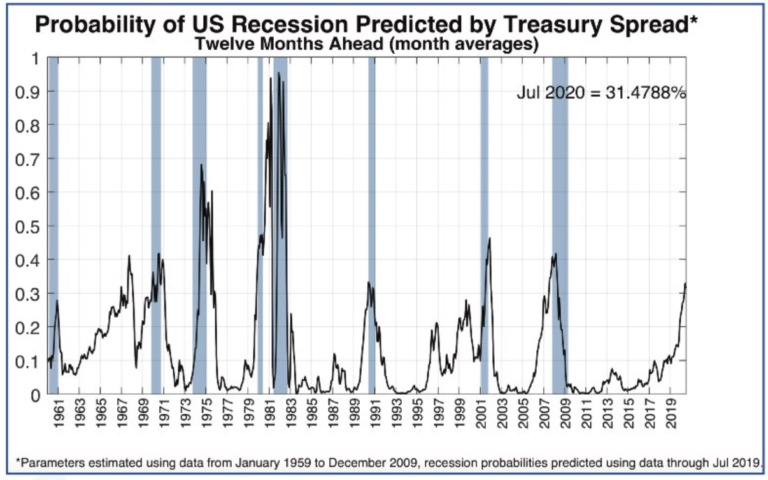
Similarly, my great friend Grant Williams recently wrote that the New York Fed’s treasury spread monitor has had a flawless recession forecasting record since 1960. This is most ironic since the Fed itself has missed every one, not just over the last 60 years but going all the way back to the end of WWII.
Source: Things That Make You Go Hmmm
As you likely surmised, the New York Fed’s indicator is strictly a function of the yield curve. Consequently, James (No Bull) Bullard’s appraisal on the urgency of normalizing the yield curve is certainly logical.
The way in which the Fed would try to get the curve uninverted is to slash interest rates fast and hard. It might also seek to “twist” the yield curve, as it has done in the past, by selling longer term securities (thereby driving their prices down and yields up) and buying shorter maturities (pushing their rates down).
*The inversion of the 2-year vs the 10-year treasury notes.
Regardless, the majority of commentators continue to diss the yield curve’s message. Frankly, I would have more sympathy for this view if it wasn’t for the swelling body of evidence indicating this expansion is close to fork-sticking time. Past EVAs have often discussed the Chicago National Activity Index because it is the broadest of all US economic measures, consisting of 85 different components. This index has eroded in seven of the past eight months. This isn’t proof-positive of a looming contraction but it’s a serious alarm bell. Additionally, the closely-watched US ISM (Institute of Supply Management) manufacturing index was reported earlier this month and it was a dismal 49.1 (below 50 signifies contraction). Worse yet, the forward-looking New Orders sub-index was a very weak 47.2.
The stock market is clearly sniffing this out. The cyclical elements of the S&P 500 were recently down 17% from their peak levels, not far from actual bear market territory, defined as falling more than 20% from a zenith point. (This week has seen a partial reversal of this decline.)
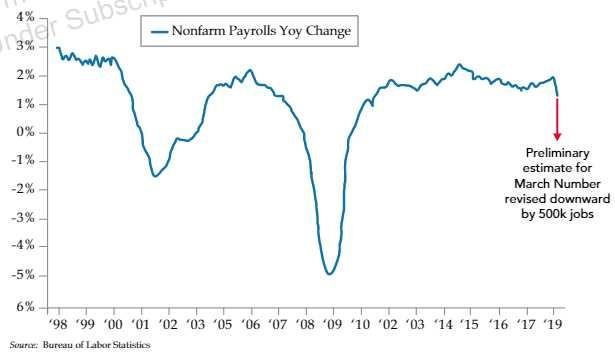
As we’ve often noted in these pages, the shining star of this expansion has been the jobs market. But as we’ve also been observing in earlier EVAs, labor market conditions are fraying. Lately, that’s turned into an outright rip. The Bureau of Labor Statistics recently announced a 500,000-job downward revision through this past March.
Make Job Creation Great Again
Source: Bureau of Labor Statistics, Danielle DiMartino Booth
Speaking of revisions, and returning to the earnings theme, there was a recent momentous recalculation by the government that has received little notice outside of these pages, Charles Schwab’s Liz Ann Sonders, David Rosenberg and another friend of mine, Danielle DiMartino Booth. This revision had the effect of erasing all pre-tax profit growth for Corporate America back to—are you ready for this—year-end 2011.
For some reason, when the perma-bulls briefly concede this point, they invariably say since 2016. While that’s technically true, what they fail to mention is that the earlier earnings recession in 2015 brought profits back to where they were at the end of 2011. Note that this is on a pre-tax basis for both public and private companies, so it excludes the steroid effect of the Trump corporate tax cut and also the ultimate performance-enhancing drug of share buy-backs. There’s little doubt that the Fed’s eight-year suppression of interest rates, before it belatedly tried to raise them back to “normal”, was the great enabler of the stock repurchase mania. (Note that it was only able to raise up to 2 3/8% on the fed funds rate before the market started cracking; this is the first time since the 1930s, by the way, that such a miniscule interest level caused a stock market seizure.)
It’s fair to note that not all US recession indicator warnings are lit up. The Index of Leading Economic Indicators (LEIs) still looks reasonably robust, as does consumer spending (though the latter has been goosed lately by rising borrowings and falling savings). Moreover, credit spreads (the yield difference between US government and corporate bonds) remain tight. These often begin to widen materially before serious economic and market dislocations occur. However, in last year’s traumatic fourth quarter, credit spreads seemed to follow the stock market rather than lead it, a most unusual development.
But there might be another message from both the yield curve and credit spreads that the never-say-die crowd is missing. In a recent riveting interview, Donald Amstad of Aberdeen Standard makes the critical point that the banking industry’s profitability is driven by three key factors: high interest rates (at least well above zero), steep yield curves (deposit rates low and further-out lending rates well above those), and wide credit spreads (because banks are essentially spread investors, borrowing at near government bond rates and lending out, usually, at higher yields to at least somewhat risky borrowers, like companies and consumers).
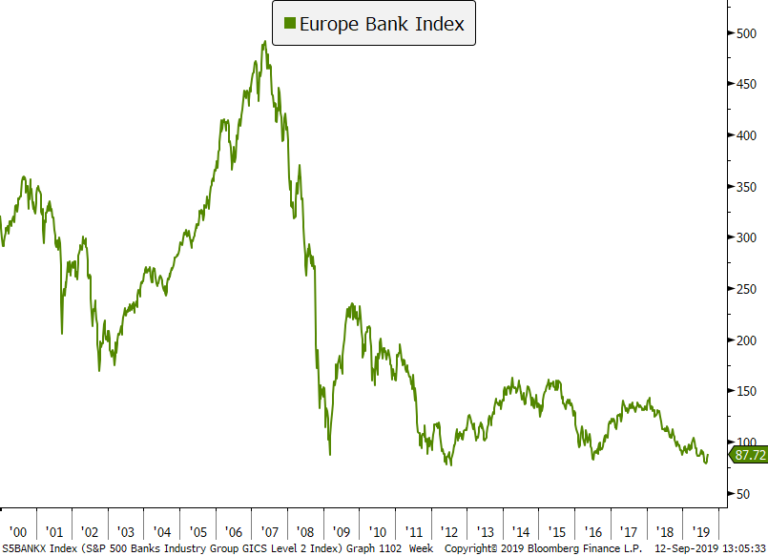
Consequently, the planet’s banks are facing a trifecta of troubles from zero and sub-zero rates, generally inverted yield curves, and tight credit spreads. Undoubtedly, those profit-sucking factors are why European bank stocks recently broke below their global financial crisis lows. Think about that for a moment: eurozone banking shares hit a lower low last month than was seen during the worst financial panic since the Great Depression.
Source: Bloomberg, Evergreen Gavekal
It’s not a lot better in the rest of the developed world, even in the US which, at least for now, still has positive interest rates, notwithstanding the inverted yield curve in the States. The chart of American banks looks a lot better than their European counterparts but it’s not great. And neither is the trading pattern of Japan’s banking sector.
Source: Bloomberg, Evergreen Gavekal
Of course, as noted in prior EVAs, the eradication of interest rates is also the kiss of death for insurance companies, pension plans, and the retired, or soon to be, investor class, a point vehemently made in last month’s Guest EVA, “The Disaster of Negative Interest Policy”. John Maynard Keynes, the progenitor of both Keynesian economics and the term “euthanasia of the rentier*” must be grinning from ear-to-ear these days from wherever his soul resides. The mega-problem, though, is that it’s nearly impossible to have a healthy economy without a healthy banking system.
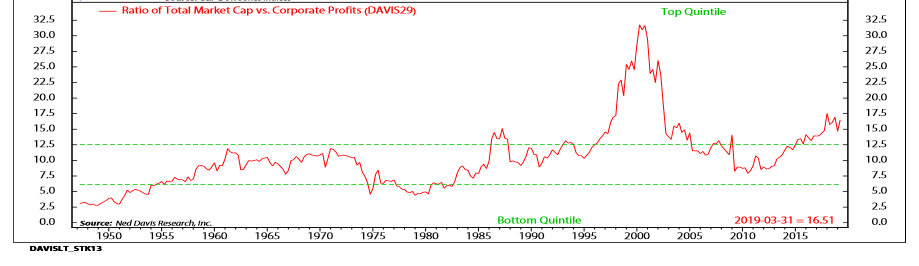
As we know, minimal to non-existent interest rates have done the double prop-up duty of pushing older investors into stocks (more to follow on this shortly) and providing corporations with cheap financing with which to repurchase their own shares. These are certainly two key reasons why the S&P 500 has been remarkably resilient despite a long and growing list of risks, some of the mega-variety (like the escalating trade war). This is why US stocks trade at one of the most generous multiples of overall corporate earnings ever seen, outside of the last few years of the tech bubble.
Stocks Very High Verses Overall Corporate Profits
Source: Ned Davis Research, August 28th, 2019
*Rentier is a synonym, in this case, for lender or investor.
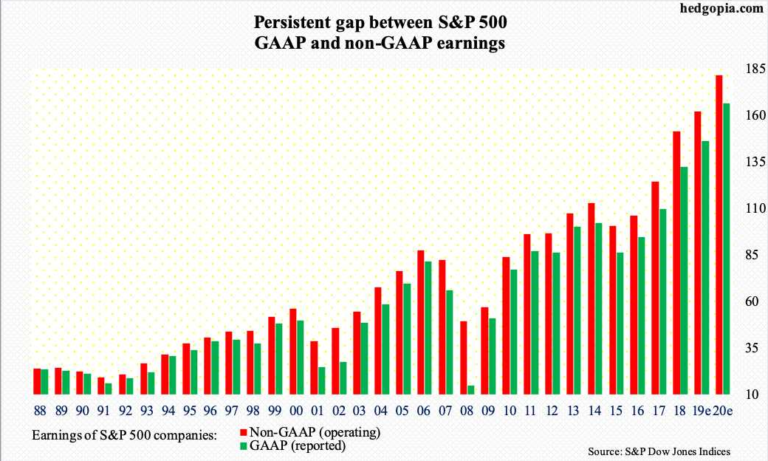
Despite the big downward revision to pre-tax profits, after-tax earnings per share remain quite lofty, though they are clearly eroding. Thus, the US stock market is elevated even compared to what are likely to be top-of-the-cycle profits. In addition to the recent profits downshift, the following chart from my friend Paban Pandey in his always interesting Hedgopia service shows the growing gap (sorry) between GAAP (Generally Accepted Accounting Principle earnings) and non-GAAP (earnings minus all the bad stuff companies want you to ignore). This growing differential is a classic sign the end is nigh for this particular profits bull market.
Note that the GAAP/Non-GAAP comparison really gapped (there I go again) in 2007 right before the Great Recession. In fact, on a percentage basis that one year was worse than any seen recently. However, the persistence of the wide differential since 2016 is noteworthy. On a cumulative basis, the spread between fact and fiction appears to be the greatest ever seen prior to the onset of a recession and bear market over the last 30 years. Yet, how often do you hear about this in the mainstream financial media? How about almost never.
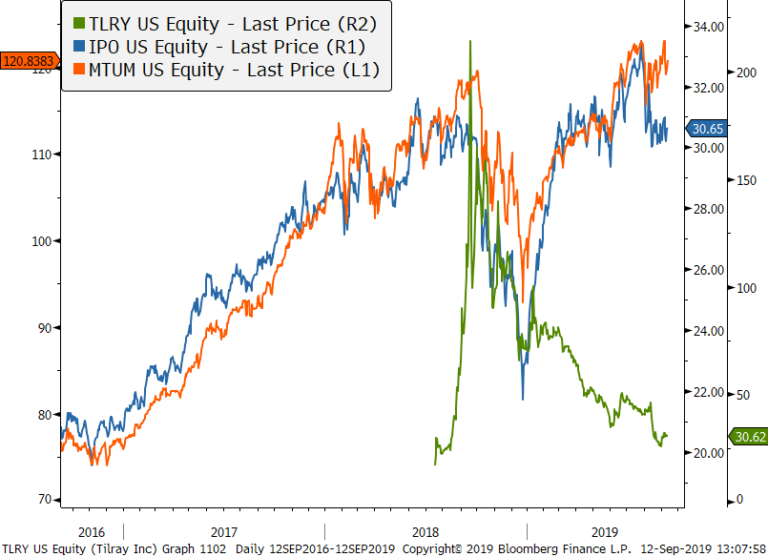
Once again, though, the market may have picked up the scent. The S&P has risen just 5% from where it was in January of 2018, despite this week’s rally (which, fortunately, has been led by the undervalued part of the two-tier market we’ve been talking about). Coincidentally, I began this “Bubble 3.0” series a month earlier, in December, 2017. The main focus of my ire at the time was the biggest bubble in human history: Bitcoin and the other crypto currencies. Since then, we’ve had a series of other bubbles such as in pot stocks like Tilray, US new issues (IPOs), and allegedly high-growth momentum stocks.
Source: Bloomberg, Evergreen Gavekal
(TLRY is a leading cannabis stock, the IPO ETF tracks new issues, and the MTUM ETF is comprised of stocks with strong price momentum, i.e., the high-flyers.)
As in last year’s fourth quarter, though, there is good news, albeit likely premature. Back on December 14th, 2018, we ran a Special Edition EVA titled “The Stealth Bear Market”. In it I wrote, referring to the carnage that had already occurred (with much more to go before the trough ten days later on Christmas Eve): “Consequently, it’s becoming hard to maintain a negative attitude toward the overall US stock market. It’s more accurate, I think, to say that large portions of it remain over-priced—in many cases, obscenely—while a growing share is looking downright appetizing.”
To that, after a brutal August this year, I would say “ditto”. The reality is that most of the obscenely over-priced issues have become even more X-rated. As earnings growth has become increasingly scarce, investors have plowed into the ultra-high P/E names (if they have any E, at all), bidding them higher and higher (as my personal short book can painfully attest!). Unless market history is now totally bunk (nod to Henry Ford), most of these will at some point disappoint their fan base, causing their market values to do a cliff-dive worthy of one of those brave souls down in Acapulco.
On the positive side, the recent pummeling of value names this summer, especially last month, has recreated another bargain hunting opportunity including in two of America’s finest companies, both of which can be had for under seven times earnings. And, no, they aren’t energy stocks! However, one in that detested sector, and which we hold for clients (unfortunately, at this point), sells for roughly one times what it earned two years ago. Yes, that would be a P/E of uno though earnings are now extremely depressed.
One of the blue-chip companies mentioned above is trading for under seven times earnings also carries a yield of 5%. This is where things get especially interesting in our view. Dozens of stocks, both in the US and overseas, have been hit hard recently. In many cases, they are yielding 4% or more. These yields already look mouth-watering versus US interest rates (and positively irresistible compared to rates in all other “rich” countries). Should rates in America tumble down closer to where they are in the rest of the world, 4% or higher yields will look even more alluring.
Accordingly, in our view, a window of opportunity has opened up with these high-yield equities that are in out-of-favor industries. By far, the energy sector offers the most luscious yields, especially with oil and gas infrastructure names that in many cases yield over 10% and with good-to-strong coverage of their payouts. But many other sectors also have stocks paying at least 4%. In days gone by, that was kind of a ho-hummer but for the world we now live in it has become the 4% solution to what ails most portfolios. It’s frustrating that investors need to take the risk of depreciation to earn 4% or 5% cash flow returns but this reality isn’t likely to change in the foreseeable future; actually, should the US be on the cusp of recession, yield starvation is almost certain to get worse, not better.
(Ironically this week has seen a powerful shift away from what I’ve been calling the COPS—as in, Crazy Over-Priced Stocks—and into the value-type issues favorably mentioned above. This is what happened back in 2000 but, of course, it’s premature to say this is the start of a “Great Rotation” out of inflated momentum stocks into far cheaper issues, often with juicy yields. This week has also brought a steepening of the yield curve due to a sell-off in longer term treasuries; we doubt that will continue for much longer based on the weakening trend in the US economy.)
It’s certainly not time to switch completely from risk-free CDs and treasuries into stocks paying 4% or more. In a bear market/recession, even these are likely to go down further. But, in our view, it’s appropriate to be dollar-cost-averaging right now into a collection of high-yielding equities, being prepared to buy more on further weakness, which is entirely possible, even probable.
A mega-risk that could certainly trigger another market dive like we saw late last year, is what’s occurring on the political front. The odds of a Democratic party sweep in November of 2020 appear to be rising. Based on the stridently anti-business tone of the leading Democratic candidates, the stock market is likely to begin discounting this possibility—like by discounting stock prices well below where they trade today. Of course, Evergreen believes the COPS are most in harm’s way (and I mean in a big way).
On the other hand, should Mr. Trump decide to abandon his trade war against China, that could cause a polar opposite reaction. If such a détente looked real and durable, it could create the long-awaited blow-off top and crescendo to this, the longest running bull market in history. However, to avoid a recession, it better happen pronto, if not sooner.
It hit me over Labor Day weekend, as I was laboring on this EVA, that 12 years ago almost to the day, my wife and I were on our 30th anniversary trip (about six weeks after our actual anniversary). We were on the island of Maui staying at the Fairmont Kea Lani and, just like now, I was working on an EVA. It would turn out to be one of my most unpopular ever (and that’s really saying something!) because in it I went out on a very lonely limb and said the odds favored a recession in 2008. Little did I know how devastating it would turn out to be but at least I warned that a downturn was likely coming.
The eerie thing is that as I write this, we are back at the same hotel for the first time since I created that warning letter in the late summer of 2007. Maybe it’s just a coincidence I should ignore and if the preponderance of evidence wasn’t piling up on the negative side of the ledger I would. But, that’s not the case. The scales have tipped far enough to the downside for me to once again say, the likelihood is the US will endure a recession next year. If so, hopefully, it will be mild. Wait a second—that’s another thing I wrote 12 years ago! Let’s pray that hope isn’t wrong again.
Tyler Durden
Sat, 09/21/2019 – 21:15 -
- Home Flippers See Profits Shrink In Latest Sign Housing Boom Is Coming To An End
Home Flippers See Profits Shrink In Latest Sign Housing Boom Is Coming To An End
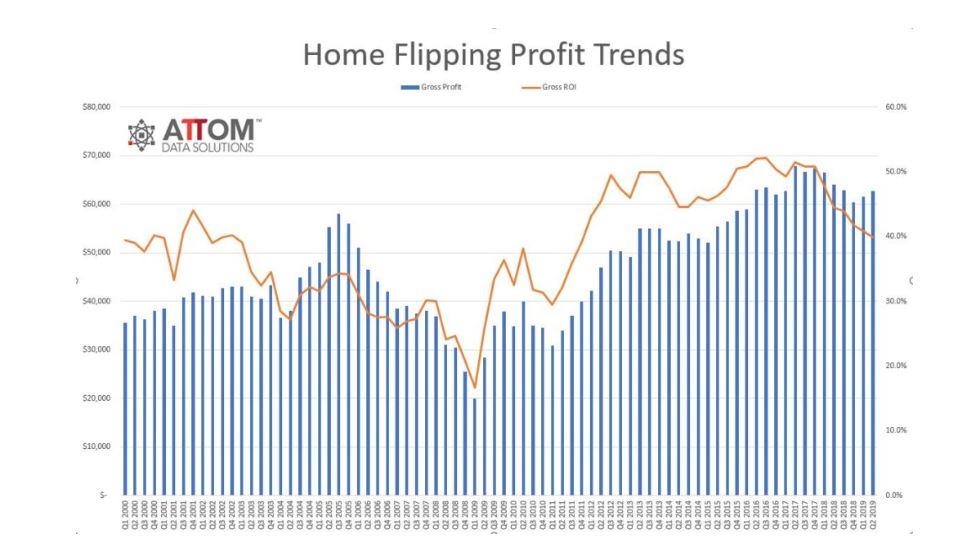
The US housing market is in the middle of modest rebound, but speculators might have played a bigger role in this comeback than many might imagine. According to ATTOM Data Solutions’ report on home flipping during the second quarter, some 59,876 single family homes were flipped during the quarter, up 12.4% from Q1 2019, but down 5.2% from a year ago. Meanwhile, profits for home-flippers shrank but just a sliver when compared with the same period from a year ago, as well as the prior quarter.
The homes flipped during Q2 represented 5.9% of total homes sold in the US during the quarter, down from a post-recession high of 7.2% from Q1. Those homes generated gross profits of $62,700, up 2% from Q1, but down 2% from a year ago.
The typical gross flipping profit of $62,700 in Q2 2019 amounted to a return on investment of 39.9%, compared with the original purchase price. That’s down from a 40.9% gross flipping ROI in Q1 2019, and down from a margin of 44.4% in Q2 2018. As the housing market has peaked, profitability has fallen six quarters in a row, as well as during eight of the last ten quarters.
One housing-market analyst quoted in ATTOM’s report explained how falling profits for home-flippers reflects a softening US housing market.
“Home flipping keeps getting less and less profitable, which is another marker that the post-recession housing boom is softening or may be coming to an end,” said Todd Teta, chief product officer at ATTOM Data Solutions. “Flipping houses is still a good business to be in and profits are healthy in most parts of the country. But push-and-pull forces in the housing market appear to be working less and less in investors’ favor. That’s leading to declining profits and a business that is nowhere near as good as it was a few years ago.”
Despite the pullback in profits, more flippers are trying their hand at the investment strategy. Out of the 149 Metropolitan Statistical Areas analyzed by ATTOM, 104 (about 70%) saw a YoY increase in the rate of home flipping. Some areas reached new peaks during the quarter, including Charlotte, San Antonio, Pittsburgh, Oklahoma City and Raleigh.
It’s not hard to see why: Though some investors inevitably lose tens of thousands of dollars, if not more, in projects gone awry. But many have also recorded massive returns, sometimes doubling their money.
ATTOM chose to break this down in an interesting way: Instead of listing the number of individual cases (which would be time-consuming and nearly impossible to compile), ATTOM instead analyzed the average ROI from the 149 MSAs examined in the report, and determined how many topped 100%. A few examples include: Scranton, Pittsburgh, Reading, Penn., Kingsport Tenn. and Augusta.
Meanwhile, markets with the smallest rates of return included Raleigh, Las Vegas, Phoenix, San Antonio and San Francisco.
The average time to flip a home during Q2 was 184 days to complete the flip, up slightly from the 180-day average recorded in Q1.
Sixteen zip codes had home-flipping rates of at least 25%, meaning that home flips accounted for 25% of home sales.
And finally, of the 59,876 homes flipped during the second quarter, 14.4% were sold to a buyer relying on an FHA program to backstop his or her mortgage, meaning that buyers of flipped homes are very likely often first-time buyers.
One thing ATTOM didn’t examine in its report: What kind of impact so-called iBuyers, companies that will buy and flip a home more or less electronically with minimal work on the part of the sellers. Steve Eisman, of ‘The Big Short’ fame, has said he’s betting against Zillow, largely because of its expansion into the iBuyer business. Here’s why.
Zillow has one of the most flawed business models I’ve seen in a very, very long time.
The part of it I find the most problematic is what they call, I believe, their iHome business, their internet buying business, where they actually go out and buy homes and flip them. I actually think the company doesn’t understand the real risks of this business, which are massive.
There are thousands of mini-markets all over the United States. They’re all local. They’re all extremely different. They all have incredibly different risks.
This is a capital-intensive business. I know only one thing for certain. Between now and five years from now, assuming the company has some level of success, there will be massive problems that they will uncover. I’m sure there’ll be write-downs, I’m sure there’ll be impairments. And I’m convinced that the investor base doesn’t have a clue about what this business is really all about.
So far, Eisman’s Zillow short has proved profitable. Looks like that trend will continue, at least for the near-term.
Tyler Durden
Sat, 09/21/2019 – 20:45 - Moscow Slams US General For Plan To Destroy Russia's Air Defenses
Moscow Slams US General For Plan To Destroy Russia’s Air Defenses
Authored by Jason Ditz via AntiWar.com,
It goes without saying that the US and Russia both have many, many plans to attack one another. Generally speaking, however, it’s been treated as bad form to bring them up, and worse form to brag about them.
So Russia is criticizing US General Jeffrey Harrigian for talking up how the US has plans to destroy all air defenses in the Russian exclave of Kaliningrad, saying there should be “no doubt” the US could do it.

Iskander-M via RT US General Jeffrey Harrigian said on Tuesday that “If we have to go in there to take down, for instance, the Kaliningrad IADS (Integrated Air Defense System), let there be no doubt we have a plan to go after that,” the Breaking Defense magazine reported.
Russian Foreign Ministry officials say they consider the statement a “threat” and also particularly irresponsible, while the Defense Ministry said that Kaliningrad is well defended from US aggression.
“Firstly we consider this a threat. Secondly, we consider such statements to be absolutely irresponsible,” Russia’s Ministry of Defense said.
“The region of Kaliningrad is reliably protected from any aggressive ‘plans’ developed in Europe by US generals passing through,” it added.
US forces in Poland often conduct wargames settling around moving north into Kaliningrad, and the region is small enough that the US could probably take it, at least for a time, in the event of a war.
Bastian Coastal Defense Missile Systems
That probably doesn’t matter, however, as a full-scale ground war between the US and Russia where they’re seizing territory almost certainly would escalate into a nuclear conflict, and by the time the general is proven right, tens or hundreds of millions of people are about to be killed in a conflagration.
Tyler Durden
Sat, 09/21/2019 – 20:15 - 12 Tons Of Cocaine Worth $575 Million Seized In Malaysia's Largest Drug Bust
12 Tons Of Cocaine Worth $575 Million Seized In Malaysia’s Largest Drug Bust
Royal Malaysia Police have seized 12 tons of cocaine worth about $575 million in the most massive drug bust ever in the country, reported Malay Mail.
The cocaine, found at the North Butterworth Container Terminal (NBCT) earlier this month, was divided in three 40ft shipping containers, which had 60 sacks of charcoal blended with the drug, a new technique used by drug smugglers to evade drug-sniffing dogs and or electronic sniffers.
Inspector-General of Police Tan Sri Abdul Hamid Bador said in a press conference on Sept 20 that government forces conducting Op Eagle, a drug busting operation at the country, deployed new technology that discovered the drugs.
“Normal drug-detecting technology would not be able to detect it. (But) our chemistry department has advanced technology that was able to detect the cocaine among the coal,” Abdul Hamid said.
Abdul Hamid said the drugs originated in South America and were transited via containership to Malaysia, with the intent of distributing across Asia.
“With the hard work and experience of the members of the chemistry department, we were able to uncover the hidden cocaine.”
All three containers were declared as coal, was the biggest drug bust in the country’s history he said at the press conference.
Abdul Hamid added that police have arrested a man, aged 29, who was responsible for handling the containers at NBCT.
The man tested positive for methamphetamine at the time of the incident and will remain in jail until Sept 23. There is no word from authorities if the man is associated with the drug cartel responsible for shipping the cocaine from South America or the distribution network in Malaysia.
Last month, police seized nearly 3.7 tons of ketamine and cocaine worth about $161 million. The sacks of drugs were found at a commercial facility in Puncak Alam, on the outskirts of Kuala Lumpur, during a raid by government forces on Aug 18.
The series of drug seizures in Malaysia shows the country is a transit point for international drug cartels. Authorities provided very little detail of where the drugs were headed next.
So we used various known shipping routes in the region to gain a perspective of where the end destination could’ve been. And judging by our map below, it’s likely these drugs were headed towards China and or Japan, and or Australia.
It remains unclear if JPMorgan had any ownership claim to the ship that delivered the CoCo’s (i.e., cocaine containers) to Malaysia the same way that JPMorgan owned the ship – the MSC Gayane – that was busted for transporting a record $1.3 billion worth of cocaine in Philadelphia this past June.
Tyler Durden
Sat, 09/21/2019 – 19:45 - "This Is The Most Alarming Trend In The Market": 1 In 4 Luxury NYC Apartments Remain Unsold Over The Past 5 Years
“This Is The Most Alarming Trend In The Market”: 1 In 4 Luxury NYC Apartments Remain Unsold Over The Past 5 Years
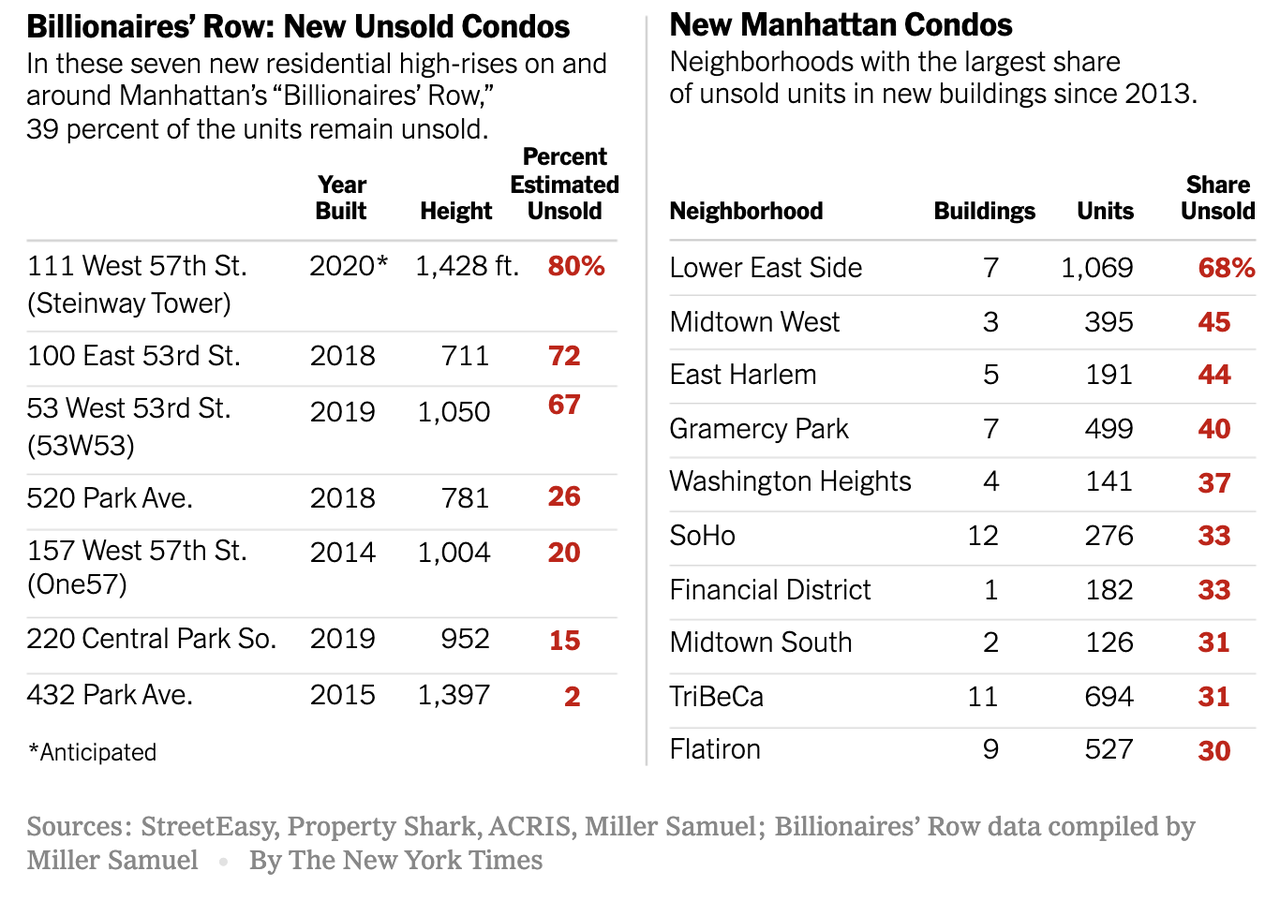
Across the US, but especially in coastal cities like New York and San Francisco, the ultraluxury property market increasingly looks like a buyers’ market. Ever since the market for condos peaked three years ago, it has been rapidly cooling off across the most popular urban markets.
We’ve been documenting this trend for a few years now, and according to a new report by the website StreetEasy that was cited by the New York Times this week, there are now more than 16,200 condo units across 682 new buildings completed in New York City that have appeared since 2013, and 25% remain unsold, roughly 4,050, most of them in luxury buildings.
The biggest difference between the the last recession and the conditions in today’s market are that projects aren’t stalling out today, perhaps due to the overabundance of cheap credit that has made virtually every unprofitable company into a “corporate zombie” which can continue existing largely thanks to record low interest rates.
“I think we’re being really conservative,” said Grant Long, StreetEasy’s senior economist, noting that the study looked specifically at ground-up new construction that has begun to close contracts. Sales in buildings converted to condos, a relatively small segment, were not counted, because they are harder to reliably track. And there are thousands more units in under-construction buildings that have not begun closings but suffer from the same market dynamics.”
Projects have not stalled as they did in the post-recession market of 2008, and new buildings are still on the rise, but there are signs that some developers are nearing a turning point. Already the prices at several new towers have been reduced, either directly or through concessions like waived common charges and transfer taxes, and some may soon be forced to cut deeper. Tactics from past cycles could also be making a comeback: bulk sales of unsold units to investors, condos converting to rentals en masse, and multimillion-dollar “rent-to-own” options for sprawling apartments — a four-bedroom, yours for just $22,500 a month.
In a city where brokers are accustomed to selling condos months, and even years, before construction is finished, this sudden freeze has left many confused as to the cause.
“That to me is the most alarming trend here,” said Mr. Long. “That’s the group of folks that could go away at any minute – if there’s a recession, people just want to put their money in Treasury bonds,” he said, referring to a lower-risk investment strategy.
What’s worse, a growing share of condos sold in recent years have been quietly re-listed as rentals by the investors who bought them, the NYT reports. Just how reluctant are buyers to try their hand at flipping? Of the 12,133 new condos sold in NYC between January 2013 and August 2019, 38% have appeared on StreetEasy as rentals.
But so far, the most impacted elements of the housing downturn in markets like NYC have been in the ultraluxury market. Over the past few years, Manhattan in particular kick-started the trend toward bigger, fancier apartments, which afforded foreign oligarchs and billionaires an easy, “no questions asked” way to park their ill-gotten gains. However, following a recent crackdown on anonymous purchases of trophy real estate coupled with the depressed market in commodities which has elimanted the Arab and Russian buyers, not to mention China’s aggressive crackdown on foreign outflows, Manhattan is now hurting the most.
Take the super-tall One57 tower, completed in 2014 and considered the forerunner of Billionaires’ Row, a once largely commercial corridor around 57th Street in Midtown, which remains about 20% unsold, with 27 of roughly 132 multimillion-dollar apartments still held by the developer, according to Jonathan J. Miller, the president of Miller Samuel Real Estate Appraisers & Consultants.
“That’s mind-blowing,” Miller said, because the building actually began marketing eight years ago, in 2011, and a typical building might sell out in two to three years in a balanced market.
In an analysis of seven luxury towers on and around Billionaires’ Row, including pending sales, almost 40% of units remain unsold, Miller said. Another competitor, Central Park Tower, set to become the tallest and, by some measures, the most expensive residential building in New York, has not released any sales data.
One expert said the biggest difference between the last recession and today is that projects aren’t stalling out today. In a city where brokers are accustomed to selling condos months before construction is even finished, this sudden freeze in demand is particularly jarring for sellers.
“That to me is the most alarming trend here,” said Mr. Long. “That’s the group of folks that could go away at any minute – if there’s a recession, people just want to put their money in Treasury bonds,” he said, referring to a lower-risk investment strategy.
By Miller’s count, which includes buildings that are still under construction, there are over 9,000 unsold new units in Manhattan. (His estimate includes so-called “shadow inventory,” which developers strategically do not list for sale to hold off for a stronger market.) At the current pace of sales, it would take nine years to sell them – a daunting timeline that could be reduced if sales were to accelerate, but there are few reasons to expect such a surge in the short term, he said.
Tyler Durden
Sat, 09/21/2019 – 19:15 - "What Were You Like At 17?": Maher Defends Kavanaugh In Fiery Exchange With Liberal Guests
“What Were You Like At 17?”: Maher Defends Kavanaugh In Fiery Exchange With Liberal Guests
On his show Friday night, Bill Maher and his panel got into a heated debate over the “new” allegations about Brett Kavanaugh – yes, the ones even his accuser can’t remember. Maher even turned on his liberal comrades, adopting the position that rehashing events from when Kavanaugh was 17 years old hurt the Democrats in 2018… and could hurt them again.
Citing polling from 2018, Maher said that Democrats could have done better in the midterm elections had it not been for the Kavanaugh hearings: “People did not like going after a guy for what he did in high school. It looked bad and now Democrats are talking about impeaching him again?” Maher said.
Guest Andrew Sullivan seemed to agree. “He probably did some shitty things in high school drunk,” he said.
And when liberal guest Heather McGhee tried to jump in, asking “May the woman please speak about what this felt like?”, Sullivan shot her down immediately: “Please don’t play that card. You’re making my point.”
When Kavanaugh’s temperament was brought up, Sullivan responded: “You try maintaining a good temperament when you’re being accused of something, you had no idea it was coming at you, came at the last minute, and that happened years and years and years ago.”
As McGhee tried to make the point that being a Supreme Court justice isn’t just a “normal job”, Maher immediately fired back: “So you’re saying at 17 you have to have your fully formed character?”
He continued: “Live in reality, man! That’s who they put up. We don’t have the votes, and now we lost seats! Are we gonna do it again? Ruth Bader Ginsburg said glowing things about him… What were you like at 17?”
You can watch the full clip, via Mediaite here:
Tyler Durden
Sat, 09/21/2019 – 18:45


Digest powered by RSS Digest
 Saving...
![<!–[if IE 9]><![endif]–>](https://www.zerohedge.com/s3/files/inline-images/kalingrad.jpg?itok=_b3WZbOW)