
- Chinese Economy Crashes To 2-Year Low; China Stocks Plunge, Asian Stocks Test 2015 Lows
Yet again the endless reasurance from the talking heads of the world is proven fallacious as the crash in China's stock market has apparently crashed its economy. China's Manufacturing PMI final print for July collapsed to 47.8 – its lowest since July 2013. The reaction is not pretty. China is down 4-8% from Friday's highs (led by high beta high-flyers in ChiNext), most Asian markets are down 2-3%, and the broad MSCI Asia Ex-Japan index is once again testing the lowest levels of 2015. But apart from that, China is contained…
Economy collapsed… but but but the clever people on TV said it wouldn't matter that stocks plunged?

Chinese stocks tumble…

As does most of Asia…

Which has smashed Asian stocks to their lowest in 2015…

Charts:Bloomberg

- History's Future
One of the assumptions about technical analysis’ efficacy is that history tends to repeat itself and, based on historical examples, the future can be anticipated with greater clarity than just hopeful guessing (a skill bulls exhibit with particular panache).
I tripped across an interesting example of this far afield from the world of finances. It has more to do with geopolitics. Check out this quote from a historian made before the cold war ever started and see if, based on what happened, it rings true (I’ve boldfaced some parts):
Today there are two great peoples on earth who, starting from different points, seem to advance toward the same goal: these are the Russians and the Anglo-Americans. Both grew up in obscurity; and while the attention of men was occupied elsewhere, they suddenly took their place in the first rank of nations, and the world learned of their birth and their greatness nearly at the same time. All other peoples seem to have almost reached the limits drawn by nature, and have nothing more to do except maintain themselves; but these two are growing. All the others have stopped or move ahead only with a thousand efforts; these two alone walk with an easy and rapid stride along a path whose limit cannot yet be seen. The American struggles against obstacles that nature opposes to him; the Russian is grappling with men. The one combats the wilderness and barbarism; the other, civilization clothed in all its arms. Consequently the conquests of the American are made with the farmer’s plow, those of the Russian with the soldier’s sword. To reach his goal the first relies on personal interest, and, without directing them, allows the strength and reason of individuals to operate. The second in a way concentrates all the power of society in one man. The one has as principal means of action liberty; the other, servitude. Their point of departure is different, their paths are varied; nonetheless, each one of them seems called by a secret design of Providence to hold in its hands one day the destinies of half the world.
So when do you think this prediction was made? Perhaps during the mayhem of World War 2, as a scholar looked past the war to anticipate what was ahead?
Nope. The above was written in the 1830s, over a hundred years before World War 2 even began, by Alexis de Tocqueville in “Democracy in America”. Pretty astonishing, isn’t it? Could you imagine making a sweeping prediction about the world’s construct in the year 2120 and being more or less correct? I, for one, am in awe of the foresight required to have speculated with such prescience. Nostradamus had nothing on this guy.

- Monsters Of Ukraine: Made In The USA
Submitted by Justin Raimondo via AntiWar.com,
We’re in the summer doldrums of the news cycle, a perfect time for our government and the media – or do I repeat myself? – to drop certain inconvenient stories down the Memory Hole. My job, of course, is to retrieve them….
Remember Ukraine? I seem to recall blaring headlines about a supposedly “imminent” and “massive” Russian invasion of that country: the Anglo-Saxon media was ablaze with a veritable countdown to D-Day and we were treated to ominous sightings of Russian troops and tanks gathering at the border, allegedly just awaiting the order from Putin to take Kiev. And it turns out there has been an invasion, of sorts – although it isn’t a Russian one. It’s the Kiev regime’s own foot-soldiers returning from the front and turning on their masters.
The war is going badly for the government of oligarch Petro Poroshenko. The east Ukrainians, who rose in revolt after the US-sponsored coup threw out democratically elected President Viktor Yanukovych, show no signs of giving up: they’ve repulsed the “anti-terrorist” campaign launched by Kiev, withstanding relentless bombardment of their cities and enduring many thousands of casualties, not to mention widespread destruction. Indeed, the brutal protracted war waged by Kiev against its own “citizens” has arguably steeled the rebels’ resolve and made any thought of reconciliation unthinkable.
As is usual with violent fanatics, the war aims of the Kiev coup leaders – to bring the eastern provinces back into the fold – have been rendered impossible by their methods and conduct. The de facto blockade imposed on the east has bound the separatists all the more tightly to Russia, and so economics as well as searing hatred of a government the easterners regard as “fascist” has sealed the country’s fate.
Unable to crack the rebels’ resolve, the “revolutionaries” who once gathered in the Maidan have begun to turn on each other. Poroshenko, fearful of the rising power of the far-right militias who make up the backbone of his makeshift army, has ordered their dissolution – and the rightists are resisting.
A standoff between the Right Sector militia and Ukrainian police the other day culminated in a pitched battle as the rightists attacked police positions in Mukachevo, in western Ukraine, and took a six-year-old boy hostage. A dispute over control of the local cigarette smuggling operation had ended with two Right Sector thugs killed and seven others – it’s not clear which side they belonged to – injured. The rightists used grenade launchers to pulverize two police cars. Oh well, no worries, Washington will send replacements…. for both the cars and the launchers.
The big problem for the Kiev regime is that Right Sector and allied far-rightist militias are the core of their military operation against the east. Right Sector provided the muscle of the Maiden revolution, standing in the front lines against the widely feared Berkut special forces loyal to Yanukovych. If these thugs must be reined in, then the success of the “anti-terrorist” campaign is doubtful: yet Kiev is increasingly unwilling to pay the high price of appeasing their increasingly troublesome Praetorians.
The aftermath of the Mukachevo stand off was a clear victory for the rightists, who saw their leader, Dmytro Yarosh, a member of parliament, negotiating with the Interior Ministry – and Right Sector militia blocking the road from Kiev to the scene of the fighting. The result was an announcement from the Interior Ministry that the police chief of Mukachevo has been suspended, pending an “investigation” of the charges of aiding and abetting smuggling.
In short, Right Sector emerged victorious. Following up their victory, the group declared that a national referendum will be held – without gathering the required signatures, and under their sponsorship – on multiple questions, essentially demanding that their entire program for the nation be adopted. They call for a formal declaration of war against Russia, a complete blockade of the eastern provinces, martial law, and the legalization of their militias. Oh yes, and they also want the present government, up to and including Poroshenko, to be impeached.
Mired in debt, and rapidly sinking into an economic abyss, Ukraine is literally coming apart at the seams – and the ugly underside of the Maiden “revolution” is being exposed to the light of day. The most recent atrocity is the uncovering of a torture chamber used by members of the “Tornado” Battalion, another far-right grouping, in which militia members kidnapped, tortured, raped, and robbed citizens in the eastern Luhansk region, where the government is fighting to retain some modicum of control. Eight members of the Tornado militia were recently arrested and are being held by military prosecutors in Kiev: the Tornado “volunteers,” who mostly consist of ex-convicts, defend their actions by claiming that this is just retaliation because they uncovered a smuggling operation run by local officials – who, they say, are collaborating with the rebels. They initially refused to lay down their arms and barricaded themselves into their camp.
The Aidar Battalion, also operating in eastern Ukraine, has been accused by Amnesty International of committing war crimes: that was in 2014, but the charges were largely ignored until the local governor began to complain. Aidar’s leader, member of parliament Serhiy Melnychuk, of the ultra-nationalist Radical Party, has been stripped of immunity from prosecution and charged with kidnapping, issuing threats, and operating a criminal gang. Melnychuk, while admitting there was “some looting,” attributed the dissolution of the Aidar Battalion by authorities to “Russian propaganda” and revealed that some members are still operating independently in Luhansk.
Then there’s the openly neo-Nazi Azov Brigade, whose members sport fascist symbols from the World War II era, and whose leader, Andriy Biletsky, declares that the goal of his group is to “lead the White Races of the world in a struggle for their survival.” There was so much bad publicity surrounding the Azov Battalion that the US Congress unanimously passed legislation forbidding any aid to the group – a provision, as this piece by Joseph Epstein in the Daily Beast points out, that is essentially unenforceable:
“In an interview with The Daily Beast, Sgt. Ivan Kharkiv of the Azov battalion talks about his battalion’s experience with U.S. trainers and US volunteers quite fondly, even mentioning US volunteers engineers and medics that are still currently assisting them. He also talks about the significant and active support from the Ukrainian diaspora in the US As for the training they have and continue to receive from numerous foreign armed forces. Kharkiv says ‘We must take knowledge from all armies… We pay for our mistakes with our lives.’
“Those US officials involved in the vetting process obviously have instructions to say that US forces are not training the Azov Battalion as such. They also say that Azov members are screened out, yet no one seems to know precisely how that’s done. In fact, given the way the Ukrainian government operates, it’s almost impossible.”
Yes, your tax dollars are going to arm, train, and feed neo-Nazis in Ukraine. That’s what we bought into when Washington decided to launch a regime change operation in that bedraggled corner of southeastern Europe. Your money is also going to prop up the country’s war-stricken economy – albeit not before corrupt government officials rake their cut off the top.
Dmytro Korchynsky, who heads a group of several far-right “volunteers” gathered together in “St. Mary’s Battalion,” declares his goal of organizing a “Christian Taliban” that will put Ukraine in the forefront of an effort to “lead the crusades,” adding: “ Our mission is not only to kick out the occupiers, but also revenge. Moscow must burn.”
That’s a goal American neocons and their liberal enablers can get behind, but Korchynsky’s invocation of the Taliban ought to make the rest of us step back from that precipice. For it was the US, in the throes of the last cold war, that coalesced, funded, trained, and armed what later became the Afghan Taliban – and we all know where that road led.
Once again, in our endless search for foreign monsters to destroy, we’re creating yet more foreign monsters who will provide the next excuse for future crusades. It’s a perpetual motion machine of foreign policy madness – and the War Party likes it that way.

- Something Just Snapped: Container Freight Rates From Asia To Europe Crash 23% In One Week
One of the few silver linings surrounding the hard-landing Chinese economy in recent weeks has been the surprising resilience and strength of the Baltic Dry Index: even as Chinese commodity demand has cratered in 2015, this “index” has more than doubled in the past few months from all time lows, and at last check was hovering just over 1,100.

Many were wondering how it was possible that with accelerating deterioration across all Chinese asset classes, not to mention the bursting of various asset bubbles, could global shippers demand increasingly higher freight rates, an indication of either a tight transportation market or a jump in commodity demand, neither of which seemed credible.
We may have the answer.
It appears that the recent spike in shipping rates was analogous to the dead cat bounce in crude oil prices: a speculator-driven anticipation for a sustainable rebound that never took place. And now, just like with crude prices, it is all crashing down…. again.
According to Reuters, shipping freight rates for transporting containers from ports in Asia to Northern Europe dropped 22.8 per cent to $400 per 20-foot container (TEU) in the week ended last Friday, data from the Shanghai Containerized Freight Index showed.

Freight rates on the world’s busiest shipping route have tanked this year due to overcapacity in available vessels and sluggish demand for transported goods. Rates generally deemed profitable for shipping companies on the route are at about US$800-US$1,000 per TEU. In other words, at current prices shippers are losing half a dollar on every booked contractual dollar at current rates.
According to Shanghai data, it was the third consecutive week of falling freight rates on the world’s busiest route. Container freight rates have so far increased in 5 weeks this year but fallen in 23 weeks.
In the week to Friday, container freight rates fell 24 percent from Asia to ports in the Mediterranean, fell 4.4 per cent to ports on the US West Coast and were down 3.7 per cent to ports on the US East Coast.
Maersk Line, the global market leader with more than 600 vessels and part of Danish oil and shipping group AP Moller-Maersk, was one of the few container shipping companies to make a profit last year. The company controls around one fifth of all transported containers from Asia to Europe.
Should the dead cat bounce in shipping rates indeed be over, and if the accelerate slide continues at the current pace, not only will shippers mothball key transit lanes, but the biggest concern for global economy, the unprecedented slowdown in world trade volumes, which we flagged a week ago, will be not only confirmed but is likely to unleash yet another global recession.

Unless, of course, central planners learn how to print trade and quite soon at that…

- The Population Bomb
Submitted by Adam Taggart via PeakProsperity.com,
In 1968, Paul Ehrlich released his ground-breaking book The Population Bomb, which awoke the national consciousness to the collision-course world population growth is on with our planet's finite resources. His work was reinforced several years later by the Limits To Growth report issued by the Club of Rome.
Fast-forward almost 50 years later, and Ehrlich's book reads more like a 'how to' manual. Nearly all the predictions it made are coming to pass, if they haven't already. Ehrlich admits that things are even more dire than he originally forecasted; not just from the size of the predicament, but because of the lack of social willingness and political courage to address or even acknowledge the situation:
The situation is much more grim because, of course, when the population bomb was written, there were 3.5 billion people on the planet. Now there are 7.3 billion people on the planet. And we are projected to have something on the order of 9.6 billion people 35 years from now. That means that we are scheduled to add to the population many more people than were alive when I was born in 1932. When I was born there were 2 billion people. The idea that, in 35 years when we already have billions of people hungry or micronutrient-malnourished, we are somehow going to have to take care of 2.5 billion more people is a daunting idea.
I think it's going to get a lot worse for a lot more people. You've got to remember that each person we add disproportionately causes ecological damage. For example, human beings are smart. So human beings use the easiest to get to, the purest, the finest resources first.
When thousands of years ago we started to fool around with copper, copper was lying on the surface of the earth. Now we have at least one mine that goes down at least two miles and is mining copper that is about 0.3% ore. And yet we go that deep and we refine that much. Same thing the first commercial oil well in the United States. We went down 69.5 feet in 1859 to hit oil. The one off in the Gulf of Mexico started a mile under water and went down a couple of more miles before it had the blow-out that ruined the Gulf of Mexico.
Each person you add has to be fed from poorer land, drink water that has to be pumped from deeper wells or transported further or purified more, and have their materials sourced from other depleting resources. And so there is a disproportion there. When you figure that we are going to have to try and feed several billion more people and that the agricultural system itself, the food system supplies something like 30% of the greenhouse gases we put into the atmosphere. Those greenhouse gases are changing the climate rapidly, yet rapid climate change is the big enemy of agriculture — you can see that we are heading down a road that leads to a bridge that’s out. And we are not paying any attention to trying to apply the brakes
Click the play button below to listen to Chris' interview with Paul Ehrlich (47m:06s)

- Citadel Barred From Trading In China After Regulator Accuses "Automated Trading" Unit Of Manipulation
Define irony: for the past 7 years, Wall Street’s worst kept secret is that Citadel, the world’s most levered hedge fund, has been the NY Fed’s just slightly more than arms-length enforcer of market stability, by which we mean spoofer, buyer and otherwise “plunge protector” in the equity and E-mini futures markets. The secret got even less “secret” when of all the possible hedge funds blogger Ben Bernanke could have gone to, he picked the Chicago HFT powerhouse, confirming the cozy and tight relationship between the Federal Reserve and the firm which has been increasingly linked to market manipulation not only in equities but bonds and virtually all other asset classes.
Which is why Citadel must have been shocked to learn late last week that China had suspended trading at a brokerage account used by Citadel in China.
When the news first broke last Friday, we asked, somewhat rhetorically, the following question:
China Suspends Trading at Citadel Unit Brokerage Account: Nikkei. Are they suggesting the U.S. PPT is China’s Dump Enforcement Team?
— zerohedge (@zerohedge) July 31, 2015
Today, the WSJ had more detail on the surprising snafu involving the Fed’s favorite market intervention vehicle, confirming that Citadel said trading in one of its China accounts has been suspended, as Chinese regulators battle a steep slide in stock prices.
The reason: China’s securities regulator said Friday it has launched a probe into automated trading and has restricted 24 stock accounts suspected of influencing stock prices. The government didn’t name any of the companies behind the restricted stock accounts. Citadel said Sunday that one of its accounts was among them.
Of course, China’s crackdown on foreign trading is not news, and had been reported about a week ago: in its endless list of scapegoatees, China had decided that blaming “evil”, if faceless, foreign sellers would be just as effective to boost confidence in a rigged market as accusing “malicious” sellers. That remains to be seen, but what is surprising is that while Citadel is best known for propping the US market higher, China is suggesting that the same NY Fed Plunge Protection Team extension was implicated in the recent downward move, using “automated trading” or otherwise. Surely, China’s regulator would not utter a peep if like in the US, Citadel had been used to support stock prices.
In comments on its website, the China Securities Regulatory Commission said it is investigating more than 50 instances of suspected securities violations and broken promises not to sell down share holdings as the country’s stock markets plunged in June and July. It wasn’t immediately clear why Citadel’s account had been targeted.
WSJ quotes a Citadel spokesman who notes that “We can confirm that while one account managed by Guosen Futures Ltd.—Citadel (Shanghai) Trading Ltd.—has had its trading on the Shenzhen Exchange suspended, we continue to otherwise operate normally from our offices, and we continue to comply with all local laws and regulations.”
What a difference a year makes: recall that in May 2014, Citadel became only the first international hedge fund to complete yuan fundraising from Chinese wealthy individuals and companies through a local unit.
Citadel (Shanghai) Foreign Investment won regulatory approval for currency exchange on March 26, marking the first qualified domestic limited partner, or QDLP, to have successfully completed fundraising in China, according to a statement from the Shanghai government’s information office.
The irony:
China’s leaders have pledged to promote freer movement of capital in and out of the country and make the exchange rate more market-based for investment purposes. Shanghai started the QDLP program last year to allow international hedge funds to raise capital in the local currency in China for overseas investments, aiding the government’s experiment with capital account convertibility and advancing its plan to build Shanghai into a financial center.
Why irony? Because a little over a year later, we find out that China is only interested in “promoting freer movement of capital” as long as it involved its stock market going higher, and the capital flowing into China, not out of it at a record pace as we commented previously.
But still the question remains – how did Citadel attract attention to itself. The answer: “The firm has recently expanded its quantitative hedge funds there, and its securities trading business traded options this year in a trial program on the China Financial Futures Exchange.”
Chinese media reported over the weekend that one of the restricted accounts was co-owned by Citadel and major Chinese brokerage firm Citic Securities. Citic Securities said Sunday it invested in the account in 2010, but it sold off its stake in November 2014 and no longer owns stock in the account, according to China’s official Xinhua News Agency. Citic Securities didn’t immediately reply to a request for comment.
And while a Citadel spokesman didn’t respond to a request for comment on which side of the firm’s business was affected by the suspension, it appears that Citadel’s infatuation with market rigging via algos and “automated trading” is what set China off. Or rather the “selling” via automated trading.
Moments ago Bloomberg confirmed as much when it reported that an official Chinese regulator urges further algorithm trading regulation, adding that China should be prudent on developing algorithm trading, Shanghai Securities News cites an unidentified official with China Securities Regulatory Commission as saying.
Market stability were “seriously damaged” by algorithm trading combined with some abnormal trading activities, the official was cited as saying. Algorithm trading may lead to systematic risks and result would be catastrophic when algorithm trading was used to manipulate market, the official was cited as saying.
Why are none of these risks ever brought up vis-a-vis Citadel’s market manipulation in the US? The answer is glaringly simple: because in the US, unlike China, Citadel always manipulates the market higher.
Which leads to an even more interesting, follow up question: if Citadel’s HFT algos were indeed caught red-handed selling in China, then someone in the US must have given the local Citadel brokerage the green light to spoof Chinese stocks lower. And since by definition Citadel does not do anything market-moving without the Fed’s preapproval, one wonders if China’s paranoia that foreigners are eager to crush its market is not at least partially grounded in reality?

- Both Sales and Earnings Are Rolling Over With Stocks Near All-Time Highs
Beyond multiple expansions driven by liquidity, sales and earnings drive stocks.
Of the two, sales are most important for determining economic conditions. Earnings can be massaged any number of ways. However, sales cannot. Either the money came in the door or it did not.
Unfortunately for the bulls, sales are falling.
1Q15 sales came in 2.4% below 1Q14. And the trend has not improved since that time.
General Electric (GE), JP Morgan (JPM), Microsoft (MSFT), IBM (IBM), Citigroup (C), Johnson & Johnson (JNJ), Intel (INTC), Coke (KO), Oracle (ORCL), Honeywell (HON), Goldman Sachs (GS), and American Express (AXP) have all reported a decline in Year Over Year sales for the second quarter of 2015.
These companies are not unique. Across the board S&P 500 companies are posting a 4% drop in revenues.
Sales are not the only metric that is tanking.
Annual corporate earnings fell last year for the first time since we entered the so-called “recovery” in 2009. This is pretty incredible when you consider the sheer amount of buybacks and other accounting gimmicks used by corporations to boost their profits.
Indeed, a study performed by Duke University found that roughly 20% of publicly traded firms manipulate their earnings to make them appear better than they really are. The folks who were surveyed for this study about this practice were the actual CFOs at the firms themselves.
All of this gimmicky has resulted in corporate profits trading at an all time high relative to US GDP. Profits literally have nowhere to go but down as corporations have cut costs to the bone and juiced earnings through buybacks and leveraged buybacks (issuing debt to buy shares).

Put simply, both sales and earnings are rolling over… at a time when the S&P 500 is close to all-time highs. This is a recipe for a correction if not a crash.
If you've yet to take action to prepare for this, we offer a FREE investment report called the Financial Crisis "Round Two" Survival Guide that outlines simple, easy to follow strategies you can use to not only protect your portfolio from it, but actually produce profits.
We are making 1,000 copies available for FREE the general public.
We are currently down to the last 15.
To pick up yours, swing by….
http://www.phoenixcapitalmarketing.com/roundtwo.html
Best Regards
Phoenix Capital Research

- The Politicians’ War On Uber
Submitted by John Stossel via Reason.com,
Hillary Clinton gave a speech warning that the new “sharing economy” of businesses such as the ride-hailing company Uber is “raising hard questions about workplace protections.”
Democrats hate what labor unions hate, and a taxi drivers’ union hates Uber, too. Its NYC website proclaims, “Uber has the money. But we are the PEOPLE!”
The taxi cartels, which provide inferior service and are micromanaged by government, don’t like getting competition from efficient companies like Uber.
Clinton didn’t mention Uber by name, but we don’t have to wonder which company she meant. The New York Times reports that Clinton contacted Uber and told them her speech would threaten to “crack down” on companies that don’t treat independent contractors as full employees. Apparently, Democrats think something’s wrong if people are independent contractors.
But no driver is forced to work for Uber. People volunteer. They like the flexibility. They like getting more use out of their cars. It’s win-win-win. Drivers earn money, customers save money while gaining convenience, and Uber makes money. Why does Clinton insist on interfering with that?
Clinton’s “social democrat” pal, New York’s Mayor Bill de Blasio, wants to crack down on Uber by limiting how many drivers they may hire. Uber cleverly responded with an app—a “de Blasio option”—that shows people how much longer they’d have to wait if de Blasio gets his way.
Good for Uber for fighting back. I wish more companies did.
Federal Express didn’t.
FedEx Ground classified drivers as independent contractors. Again, drivers were willing to drive, FedEx Ground was willing to pay, and customers got packages faster and more reliably than they did from the U.S. Postal Service.
But lawyers built a class action suit on behalf of FedEx drivers, saying they should be treated as employees, paying payroll tax, getting workman’s compensation, receiving benefits. FedEx settled the case for $228 million and began abandoning its independent contractor system.
Uber’s use of independent drivers—who use their own cars—is now called analogous to FedEx’s use of delivery drivers.
That means Uber may soon have to treat its drivers as employees. Business analysts at ZenPayroll estimate that the changes will cost $209 million. We customers will pay for that, and we’ll have fewer ride-share choices, too.
Lawsuits and politicians’ attacks against one company have a chilling effect on others. The “independent contractor” assault will destroy all sorts of companies we’ll never even know about because now they won’t come into existence.
Some of the entrepreneurs who dreamed of starting them will look at the additional costs, crunch the numbers and decide there’s not enough profit potential to risk investing their money.
Who knows what odd but popular sharing-economy innovations aren’t happening even now—ones we’d use and love—because businesspeople with great ideas are frightened by the Clintons, deBlasios and lawyers?
In France, the old-fashioned cabbies rioted against Uber, blocking Uber cars and dropping rocks on them from a bridge. Instead of arresting rioters, the French government threatened to arrest Uber executives for breaking taxi rules. Once again, without even a new law directed specifically at Uber, the enemies of free choice got their way. Paris police have been ordered to forbid use of the Uber app.
I disagree with Jeb Bush about many things, but he was right to praise Uber for “disrupting the old order” of business.
The New York Times responded with a sarcastic piece pointing out that when Bush used an Uber car, the driver, Munir Algazaly, didn’t recognize Bush. He said he plans to vote for Clinton, though Bush seemed like a “nice guy.” Another site mocked Bush because he talked about “hailing” an Uber, not “hiring” one. Another pointed out that the car Bush rode in had a license plate holder that said “Fresh as F—” on it. Ha, ha.
But it’s the sneering media who miss the point. Bush is smart to see serious benefits from “reputation” businesses like Uber. Politicians and lawyers who threaten to destroy such companies threaten us all.

- The Tide Has Turned And These Charts Predict The Next Stop
Submitted by Thad Beversdorf via FirstRebuttal.com,
What we saw with the latest GDP reports is something truly remarkable. A market that was explicitly told the past 4 years of economic growth had been overstated simply shrugged off the news. That is, absolutely no price recalibration took place. This really evidences beyond any doubt that there is no relationship between the economy and the market. It further evidences the Fed’s increased proficiency in directly guiding the market.
Now I know this is not shocking to many of us. But to watch the market’s blatant irreverence toward a report that, with the flip of a switch, removed 12% of the presumed economic growth from the past 4 years did strike me as remarkable. It shows that the printing of economic indicators is nothing but theater. There is absolutely no rational market explanation that the market traded flat to up on the day when current GDP missed estimates and the past 4 years of growth was adjusted downward, all in the midst of one of the worst seasons for YoY deteriorating corporate revenues/earnings.
But more realistically what it suggests is the only player left in the market is the ‘buyer of last resort’, i.e. the Fed and its minion entities. Certainly nobody wants to aggressively short the market in the face of a clear long only strategy by the Fed, but just as certainly no major money managers are longing this market. Volume has simply dried up.
I’ve been writing for almost a year now about the economic cannibalism that has been feeding earnings growth. I have discussed this concept with a dire warning that feeding earnings expansion through operational contraction is a short lived meal. And well we are now seeing the indications that the growth through contraction has now hit its inevitable end. Have a look at the following chart which is really the only chart one needs to study at this point. The chart depicts S&P 500 adjusted earnings per share (blue line), S&P Price level (green line), S&P 500 Revs per share (red line) and US Productivity of Total Industry (olive line).

I have normalized the parametres back to the early 1990’s so that we can better understand the absurdity of what’s been taking place. Now there is a tremendous amount of information we can pull out of this chart so stay with me here.
The initial observation is that the past 25 years has been a series of large bubbles and subsequent busts, at least in both the price level and adjusted eps of the S&P. Focusing on the price level we see the normalized index having two similar peaks and now into a third peak quite substantially higher than the previous two. The first two peaks top out around 400 on the index and each subsequent reset price was down around 220. Now one might expect that the sources of these two very similar bubbles were thus the same. But one would be wrong.
Notice in the first bubble that adjusted EPS topped out around 275 whereas in the second bubble they reached 450. We often hear that because of this phenomenon equities were far more overvalued in the tech bubble than in the credit bubble. While the conclusion is correct it creates a strawman analogy for this third and current bubble. Specifically, that because current price to earnings is similar to that of the credit bubble that equities are fairly priced or at least relative to the tech bubble. But this argument is a strawman fallacy.
The tech bubble was a bubble of massive direct capital allocation stupidity. The credit bubble was a bubble of massive indirect capital allocation stupidity. What I mean by that is the tech bubble was created by absurd capital injections directly into the secondary market (bypassing earnings), driving stock valuations to the moon. The credit bubble was done via flooding consumers with debt which was used to prop up personal consumption which led to growth in revenues, earnings and thus stock valuations. You can see a large increase of revenues per share between 2001 and 2007. Now revenue growth is supposed to lead earnings growth which in turn pushes up stock valuations. However, when revenue growth is driven by debt consumption it is temporary. And we all learned that cold, hard fact in 2008.
But so the argument that EPS is the figure one needs to pay attention to really misses the actual driving force which is revenue based earnings growth. The above chart depicts that while EPS has been rising significantly for the past 7 years, revenues have been absolutely flat. And so what we have is earnings growth pushing stock valuations massively higher but without the consumer onboard. Very different from the credit bubble. How does this happen?
Well again, stock valuations are being pushed higher through another temporary effect. EPS growth is coming by way of operational contraction and financial engineering – meaning dividend payouts and share buybacks. This is evident in the following chart of just this latest bubble that depicts growth in stock valuations relative to growth in revenue per share, which have (notably) declined since Aug 08 (the base period).

Now EPS growth from anything other than earned consumption, meaning consumption from income rather than debt can only be temporary. (One arguable exception would be if EPS growth came from productivity, however, we see in this first chart that productivity is flat and so not the driver of EPS growth.) And if the EPS growth is temporary it follows that the stock valuations that have grown on the back of EPS growth too is temporary. What we are about to find and already are seeing the signs of with major technical supports breaking down is that stock valuations will reset to match each firm’s operational propensity for earnings growth (i.e. each firm’s expected sustainable future free cash flow). We saw this inevitable result in each of the last two major bubbles.
Interestingly if we look at the macrocosm of the capital mix between earnings and incomes what we find since moving to a pure fiat based currency in 1971 is that while incomes are very steady as a percentage of gross domestic income (GDI), profits have been more volatile. And since the large positive inflection point of money printing in 1993, corporate profits as a percentage of GDI have gone berserk. For investors it is imperative to understand what happens to stock valuations when profits’ share of GDI collapses. In the following chart I have normalized, back to 1971, income and profits’ respective shares of GDI.

You can see income has steadily declined as a percentage of GDI while profits’ share has bounced around. But we can see that starting in the mid 1990’s profits’ share of GDI has seen massively growing bubbles and busts. This is a direct result of the temporary earnings growth scenarios discussed above. That is, rather than implementing policies that create steady long term income and earnings growth the Fed and the government have been creating policies that act as bandages. And so while we cover up the infection for short periods, eventually the infection not only reappears but spreads resulting in a continuously worsening problem for which ever more extreme bandages need to be used to cover up the problems.
Today there is an even bigger problem in that the world has been riding China’s coat tails of growth so to speak. But looking at the following chart what we find is a huge dislocation between China’s growth machine (i.e. industrial production) and the valuation of world equity markets. The dislocation really began around the time the Fed implemented Operation Twist at the end of 2011, which fed directly into QE3.

We can see a similar indicator of industrial growth decelerating by looking at collapsing materials prices which began to deteriorate around the same time that the above dislocation started in late 2011.


Despite now hearing fewer and fewer industry ‘pros’ shouting their euphoric calls for 20 year bulls we still get a constant barrage of delusional analyses. We continue to hear about a strong job market when the opposite is true. U6 (i.e. the truest official unemployment figure) remains well into the double digits. As reported today by MarketWatch, labour cost index is at its lowest growth rate since 1982 and the U.S. has gained only an average of 208,000 jobs a month this year, down from 260,000 in 2014, a 20% decline YoY. Those are the real facts and those are in the face of the lowest labour participation rate since the 1970’s and the highest number of people on government subsidy programs on record.
In short, the last 20 years has been nothing but bad policies attempting to cover up the results of previous bad policies creating a need for more extreme policies to cover up more extreme resulting fundamental problems. This is clearly depicted in the data. The end result is that global growth has deteriorated steadily now for the past 6 years to its lowest long term trend line in modern history, now below 2%.

Like the chicken and the egg, economic output and incomes are inherently intertwined.

Be prepared for the now imminent equity valuation reset. It is true the Fed now has the ability to manipulate the market well beyond anything we’ve ever seen before. However, it is also still true that when the bursting bubble achieves full momentum the Fed will be helpless to stop it. While the Fed feels increasingly omnipotent they will once again learn, that while natural laws can be bent, they cannot be broken.

- Is This The Most Successful Trade Of The Last Decade?
If the longs use VIX products as hedging instruments, then why would anyone take the other side? Especially in light of the fact that, as we discussed previously, only 1 in 20 "skilled" traders profit from VIX ETFs.
Because, being short volatility can be very profitable, according to Goldman. Year-to-date this short vol index is up 56%, and selling the front-month VIX has earned a massive 114 vol points…

The Short Story: Short VIX futures index +56% ytd; If the longs use VIX products as hedging instruments, then why would anyone take the other side? Because, being short volatility can be very profitable. The S&P 500 VIX Short-term Futures Daily Inverse Index (SPVXSPI) tracks the profitability of being short a constant maturity 1m VIX future and is the benchmark for ETPs such as the XIV and SVXY. Year-to-date this short vol index is up 56%.

In low vol environments VIX futures tend to trade above VIX spot and futures typically roll down the curve to settle at VIX spot.
Short VIX futures strategies profit from the contango in the VIX futures curve. The steeper the VIX term structure, the higher the (futures-spot VIX) basis, and short VIX strategies tend to be profitable as futures roll down the curve. There are many investors who try to profit from this well publicized phenomenon: sell a VIX future, capture roll down, do it again (wash, rinse, repeat).
Prior to VIX Weeklys if you wanted to capture the roll-down you might have sold the front-month contract and hoped for the best. Short vol investors know that putting all of your eggs in one basket can be a risky strategy.
VIX Weeklys may provide more flexibility with investors positioning for the roll-down a bit week each week by simply spreading out their monthly trades. Instead of selling $100 on the front month VIX future an investor might sell 1/4th of the notional per week which may help smooth the return profile. The VIX often mean reverts quickly so if one contract expires in the red, the other contracts may pick up the speedy mean reversion and end in the green.
On the tactical side, we could see more investors positioning for a swift decline in volatility post an event (FOMC for example).
Shorter-dated VIX futures track VIX spot more closely
A one-month VIX future has a beta of 0.44 to the VIX. For example, if the VIX moves up a vol point, a future with one-month left to expiration tends to move up a little less than half as much, or 0.44 vol points.
Higher betas for shorter-dated tenors. The beta between a future with one week to expiry and the VIX has been 0.64 or 1.4x higher than a one-month future and 2.2x more sensitive to VIX moves than a future with three-months remaining to expiration.
Many exchange traded VIX products are benchmarked to constant maturity VIX futures. As a cross check on our reaction function we create constant maturity one- to six-month VIX futures each trading day and estimate the betas back to VIX changes. The results are very similar, with a constant maturity one-month VIX future having a beta of 0.45 to VIX changes and threemonth futures at 0.27, very close to what our reaction function would have predicted (1m: 0.44; 3m: 0.29).

Shorter-dated VIX futures track (have more manipulative leverage) the market more closely…
The beta between daily changes in the VIX and daily S&P 500 returns has been -1.2 using data back to 2004. A beta of -1.2 implies that for every -1% decline in the S&P 500 we would expect the VIX to go up by 1.2 vol points (say from 15 to 16.2).
The beta of a one-month VIX future to S&P 500 returns is -0.60, roughly one-half the sensitivity between the VIX and market returns; about 1.5x that of a three-month future (-0.41) and 2.1x a six-month future (-0.28). We make two important points here: (1) you cannot trade spot VIX and the betas between the tradable VIX futures and the market have historically been much lower; (2) the betas fall off dramatically as you move further out in the term structure.

As a VIX future approaches settlement, its sensitivity to S&P 500 returns grows exponentially. The beta of a VIX future to S&P 500 returns moves from -0.6 on a one-month future to -0.74 on a two-week and -0.86 on a future with one-week left before VIX settlement and -1.15 with one-day left to maturity which approaches the beta of VIX spot (-1.2).
* * *
So – in summary – being short vol has been among the best performing trades of the last decade (never mind the risk-side) and, the introduction of weekly VIX futures (and the exponential decay implied by these volatility-inducing instruments) offers, according to Goldman Sachs, even more opportunity for active risk takers to sell vol, scrape premium, and face unlimited downside risk… playing the contango collapse game until there are no more musical chairs left.

- If Price Insensitive Buyers Become Sellers, Will The Entire Market Collapse?
One narrative we’ve been building on for quite some time is the idea that both stocks and bonds have been propped up by a perpetual bid from price insensitive buyers. Put simply, it really doesn’t matter how overvalued something is if your primary concern is something other than maximizing your return on investment.
Take corporate buybacks for instance. Both equity-linked compensation and the market’s tendency to focus on quarterly results at the expense of the bigger picture have compelled corporate management teams to develop a dangerously myopic strategy that revolves around tapping corporate credit markets for cheap cash and plowing the proceeds into EPS-inflating buybacks. Whether or not this is the best use of cash is certainly debatable but when the goal is to manage earnings and appease stockholders, that doesn’t matter, and indeed, companies have an abysmal record when it comes to buying back shares at levels that later prove to be quite expensive.
In America, the price insensitive corporate management bid simply replaced the monthly flow the market lost when the Fed – the most price insensitive of all buyers – began to taper its asset purchases. Of course QE in all its various iterations playing out across the globe, is price insensitive buying taken to its logical extreme. With the ECB’s PSPP for instance, limits on the percentage of an individual issue that NCBs are allowed to own apply to nominal amounts meaning that, to the extent NCBs can buy bonds at a premium to par, they can effectively buy fewer bonds than they otherwise would have and still hit their purchase targets. In other words, if you overpay, it’s easier to stay under the issue cap when supply is scarce in eligible paper. So in some respects, the more EMU central banks pay for the bonds they purchase, the better.
In Japan, the BoJ has amassed an elephantine balance sheet full of ETFs and because one cannot classify stocks as “held to maturity”, Haruhiko Kuroda’s equity plunge protection is effectively a self-feeding loop – that is, the more stocks the central bank owns, the more it must buy in order to protect its balance sheet from the damage it would suffer were equities to sell off.
And then there are banks, mutual funds, and pension plans which for various reasons (regulatory and otherwise) are forced to accumulate assets at otherwise unattractive prices.
The question in all of this – and this may indeed become one of the most important considerations for market participants once every DM central bank bumps up against the Sweden problem – is this: what happens when the price insensitive buyers behind the inexorable rise in financial asset prices become price insensitive sellers?
Here with more on that question and more, is GMO’s Ben Inker:
* * *
Price-insensitive sellers
The last decade has seen an extraordinary rise in the importance of a unique class of investor. Generally referred to as “price-insensitive buyers,” these are asset owners for whom the expected returns of the assets they buy are not a primary consideration in their purchase decisions. Such buyers have been the explanation behind a whole series of market price movements that otherwise have not seemed to make sense in a historical context. In today’s world, where prices of all sorts of assets are trading far above historical norms, it is worth recognizing that investors prepared to buy assets without regard to the price of those assets may also find themselves in a position to sell those assets without regard to price as well. This potential is compounded by the reduction in liquidity in markets around the world, which has been driven by tighter regulation of financial institutions, and, paradoxically, a greater desire for liquidity on the part of market participants. Making matters worse, in order to see massive changes in the price of a security, you don’t need the price-insensitive buyer to become a seller. You merely need him to cease being the marginal buyer. If price-insensitive buyers actually become price-insensitive sellers, it becomes possible that price falls could take asset prices significantly below historical norms.
Monetary authorities
The first group of price-insensitive buyers to confound the markets were, arguably, the monetary authorities of emerging countries, who in the 2000s began to accumulate a vast hoard of foreign exchange reserves. These reserves, which served to both protect against a recurrence of the 1997-98 currency crises and to encourage export growth by holding down their exchange rates, needed to be invested. The lion’s share of the reserves went into U.S. treasuries and mortgage-backed securities, causing Alan Greenspan and Ben Bernanke to muse about the conundrum of bond yields failing to rise as the Federal Reserve lifted short-term interest rates in the middle of the decade. I have to admit that from a return standpoint, those purchases were ultimately vindicated by the even lower bond yields that have prevailed since the financial crisis. But just because the position turned out to be a surprisingly good one, return-wise, doesn’t mean that these central banks were acting like normal investors. Their accumulation of U.S. dollars had nothing to do with a desire to invest in the U.S., in treasuries or anything else, but was rather an attempt to hold down their own currencies.
Developed market central banks
The financial crisis itself created the second group of price-insensitive buyers, developed market central banks. Quantitative easing policies by a wide array of central banks have had the explicit goal of pushing down interest rates and pushing up other asset prices. While one can argue that the central banks were anything but price-insensitive in that they cared quite deeply about the prices of the assets they were buying, they certainly were not buying assets for the returns they delivered to themselves as holders, and their buying has been driven by an attempt to help the real economy, not an attempt to earn a return on assets. Since 2008, the sum of the U.S., U.K., Eurozone, and Japanese central banks have expanded their balance sheets by over $4 trillion USD, as shown in Exhibit 2.

At the moment, the most active central banks in the developed world have been the European government bonds.
Defined benefit pension plans
Considerations of profit and loss on their portfolios are seldom at top of mind for central bankers, making them obvious candidates as price-insensitive buyers. But regulatory pressure can push otherwise profit-focused entities in similar directions. Successive tightening of the regulatory screws on defined benefit pension funds, particularly in Europe, have forced many of them into the role of price-insensitive buyers of certain assets as well.
Risk parity
Another group of price-insensitive investors are managers of risk parity portfolios. These portfolios make allocations to asset classes not with regard to pricing of assets, but rather their volatility and correlation characteristics. Their price-insensitivity comes out in a couple of ways. First, as money flows into the strategies, they are levered buyers of bonds and inflation-linked bonds in particular. Like most strategies, if the money flows out, they are forced sellers of a slice of their portfolio. Second, unlike many other investors, they will also tend to buy and sell based on changes in volatility. As the volatility of an asset falls, these strategies will tend to lever it up further, and as the volatility rises they will sell. Given that low volatility tends to be associated with rising markets and high volatility with falling markets, this gives their buy and sell decisions a certain momentum flavor. If bond prices are moving up in a steady fashion, they will tend to buy more and more as volatility falls, and in a disorderly sell-off that sees yields and expected returns rise along with rising volatility, they will sell the assets due to their higher “risk.” In fact, rising volatility in bond markets could cause a general delevering of risk parity portfolios, causing them to sell assets unrelated to bonds in order to keep their estimated volatility stable. With hundreds of billions of dollars under management in risk parity strategies and large holdings in some of the less deeply liquid areas of the financial markets such as inflation-linked bonds and commodity futures, it is easy to imagine their selling in unsettling markets under certain circumstances, such as a repeat of 2013’s “Taper Tantrum.”
Traditional mutual funds
While the levered nature of risk parity portfolios may cause them to punch above their weight in potentially disrupting markets, in the end it isn’t clear that they are more likely to cause trouble than the managers of traditional mutual funds.
The mutual funds are at the mercy of client flows. As money has flowed into areas such as high yield bonds and bank loans, they have had little choice but to put it to work, and given their mandates, prospectus restrictions, and career risk, they are largely forced to buy their asset classes whether or not they think the pricing makes sense. But to an even greater degree, when redemptions come, they have no choice but to sell. This is nothing new. But what has changed is the extent to which mutual funds have seen large flows into increasingly illiquid pieces of the markets, particularly in credit, where bank loan mutual funds are 20% of the total traded bank loan market and high yield funds make up another 5%. That may not sound particularly large, but almost half of that market is made up of CLOs, which are basically static holders of loans. This makes the “free float” of the bank loan market perhaps half of the total, and should the bank loan mutual funds sell, there are not a lot of investors for them to sell to.
This is particularly true given the changes to the regulatory landscape for the dealer community. Banks are much less likely to take bonds and loans on their balance sheet for any length of time in the course of their market-making activities.
Conclusion
The size of the price-insensitive market participants is impressive. Monetary authorities and developed market central banks have each bought on the order of $5 trillion worth of assets for reasons that ultimately have nothing to do with earning an investment return on them. Regulatory pressures have caused pension funds, insurance companies, and banks to do likewise. While it is somewhat harder to put precise numbers to the size of these investments, it seems a safe bet that the total is in the trillions as well. Other investors are in analagous positions for different reasons, as strategies such as risk parity and the exigences of life as a mutual fund portfolio manager push such investors to also buy assets for reasons other than the expected returns those assets may deliver. To date, these investors have tended to be buyers, and given their lack of price-sensitivity, they have pushed up prices of assets beyond historically normal levels.
At the same time, a natural buffer for many markets against a temporary imbalance between buyers and sellers, the dealer community has been forced to significantly curtail its activities due to the regulatory regime. So if circumstances cause these price-insensitive buyers to turn around and become price-insensitive sellers, there are not a lot of candidates to take the other side.
Be prepared for the possibility that some of the same assets that have again and again risen to prices that many investors said were impossible show more downside volatility than investors have bargained for.

- To Social Media's Horror – It 'Is' Different This Time
There has probably been no greater investing mantra placed upon an industry in recent memory than the now reflexive, as well as defensive response of “It’s different this time” when questioning anything Social. Trying to understand the business model along with its metrics, valuations and more is not only arduous, the response seems more akin to pulling teeth without anesthesia for those selling it, defending it, or both.
Those that have been with me for a while know I have little use for the whole “social media” thing. Although, while I don’t use any of it myself, that doesn’t mean I don’t see value and innovation in many of them. Again, I don’t use them, nor have accounts. However, I do have share buttons on my own site for those that do. So let me be clear:
It’s the valuations along with the metrics of their underlying business models and just how effective they are for those that are in business, along with the ROI for those businesses whether monetarily or in other ways for their time and money is what I take issue with. For as I’ve stated over and over again: “The only people making money in social media – are those selling you social media.”
When it comes to everything social, today, recent memory is about the last 5 to 6 years. Or: post financial crisis. Basically, everything you know, or think you know about valuations, their coming into IPO existence, as well the metrics they stood on (and still use) as to “prove” those valuations has all been within the most adulterated markets in history fueled by the advent of “free money” made possible by The Fed. via QE. This is a quantitative, as well as a qualitative fact. Period.
Never before has this (QE) been done in the history of the markets. So obscene has the valuation process become along with the metrics used to support it is why, “It’s different this time” was born. And precisely one might ask “why was that?” Well, just as a teenager who can no longer defend what they’re arguing and immediately cuts off further discussion with, “Because! Just because!” followed with “You just don’t get it!” When you’re wearing a $3K power-suit, “It’s different this time” sounds more grown up. Yet it serves the same purpose: It cuts off discussion leaving all the vagaries well intact. Nevertheless, there’s really no difference except for the wording.
The world of everything Social has been the undisputed benefactor of all this “free money.” After all, wasn’t the term “Unicorn” applied and accepted with all its connotations as being a mythical creature that lived and breathed in the land of make-believe? Social has spun out more entities with BILLION dollar valuations that either never made, or, currently making – a single cent in net profit. Or worse; having no sales period! One can see why the “Unicorn” title was so applicable here, as well as the need for a catch phrase to deflect any nay-sayers.
It is incontrovertible that if not for the “free money” provided by QE, many, if not most of what currently falls under the social media umbrella would not only never had come into existence (let alone with Billion dollar price tags) the perceived “hands off – unquestioning” attitude by Wall Street itself as many of the current top-tier entities spent Billions upon Billions of resource dollars making acquisitions – before they themselves have reached any true net profitability that could warrant such spending would be allowed. This in my opinion is an absolute wanton abandonment of business fundamentals and principles.
However, it seems there is a change of mood (or realization the jig is truly up) on Wall Street.
Back in September in my article “The Shot Heard Round The Valley World” I opined…
“Let me go on the record here and point out what I believe will prove my point in the coming weeks and months.
Currently Zuck and crew have been lauded over with the prowess in its acquisition choices. You will know everything has changed when the calls to rescind Mark Zuckerberg’s authority in having carte blanche via not needing board approval for acquisitions going forward is demanded by Wall Street.”
What transpired during the most recent earnings call? At first what is shown to suggest as their still hitting on all cylinders they once again reiterated: they’re going to continue spending at just as impressive a rate. And the response this time? Suddenly far more concerned are those on Wall Street this time, than any time previous. The validation for it was near impossible to miss, as it was the singular point touted extensively, in unison, across all the financial media outlets. A prelude in my opinion for the coming demand I alluded to previously. An opinion I’ll contend was laughed at just months ago. Yet, suddenly – it’s no longer all that funny and is becoming a very serious probability.
In my opinion the only reason for the stock not dropping in sympathy (i.e., like a rock) resembling its other brethren of late was only for its current liquidity for the HFT’s too feast upon in the quarter end, window dressing made ever so prevalent in today’s near non-existent participation rated “market.” However these “stick-saves” are becoming increasingly short-lived. Just look to any other recent all time high flyer this quarter. Is it a: lifetime high based on fundamental principles? Or: A speculative stop run, HFT fueled blow off top in a month end earnings period? You be the judge is all I’ll say. Yet, there are clues everywhere if – one wants to truly see.
Remember: If the cohort of analysts or media venues that reached for every keyboard, camera, or microphone to justify why a company like Apple™ could suffer the fate of their stock gapping down some 4% or so after reporting a record-breaking 47.5 million iPhones®, an actual physical, quantifiable sale of a real product that generated Billions of actual net profits that were added to their existing coffers and the stock gets pummeled? What does that bode for the likes of many of today’s Wall Street darlings? Again, just for context: Apple delivered true net profits that produced surplus “cash” in the bank that the “Likes” of today can only dream of. Don’t let that point be lost. (Those coffers by the way are larger than the total market cap of many of today’s social darlings.)
Whether one likes Apple, their products, or story is irrelevant. What can’t be denied is they generate net profits that result in surplus “cash” in the bank. And they were subsequently hammered. How do you think the social media space will fare going forward from here since there’s no longer any QE, but legitimate valuation fears are manifesting within all stocks in general world-wide?
Maybe it’s just me, but I find it near laughable that these once social darlings just a few years since IPO-ing seem to be trying (or desperately seeking) ways as to find ways to expand, grow, justify, and more with anything but their raison d’être (i.e., their actual core business.) Along with every analyst as well as company figure-head contort their earlier views on why their valuations, metrics, and models are/were sound. For instance…
Facebook™ needs to make sure everyone is still on-board with its spending (because as implied – they’re gonna!) The reasons I guess are they’re realizing “Likes” ain’t gonna cut it. Whether investors will like that or not, and by how much, we’ll know soon enough over the coming weeks, or months. However, as I expressed earlier, this earnings call was “different this time” with the near knee-jerk as well as residual hand wringing about Zuck and crew’s continued adamant stand on spending.
And what should not be lost is how different it was as Wall Street awoke and became fully cognizant to the money they’ll be spending won’t be the “free money” afforded via QE. Rather, it will be today’s current share holders. In other words: Wall Street’s pockets.
And what is always front and center in Wall Street’s mind is: Facebook can spend all the money it wants – just as long as it isn’t Wall Street’s. For one must remember, Facebook doesn’t make a net profit via true unadulterated GAAP earnings to warrant (in my view) the expense of it spending those BILLIONS of dollars. That was in the days of “Trust us – we know what we’re doing.” Well trust me: Those days are over. Period.
Want another example? How about Twitter™? Let’s put them into perspective. I’ve been saying since their inception as well as IPO that this medium is truly revolutionary as to its application or niche. However, as a business model along with its valuation? I’ve railed about it for just as long. Below is an excerpt from an article I wrote in November of 2013 when Twitter was about to IPO.
“Never mind what their stock valuations are currently. A stock is not a company. The stock today lives in a world of its own divorced from reality. What I’m talking about here is business. What and how are these enterprises going to generate income as in revenue to support these valuations? Remember, if the markets as I have been pounding my fist over the last few years is based purely by Federal Reserve interactions. Adulterating them beyond the resemblance of the financial markets everyone once understood and could agree on. Then these Wall Street darlings can not only crash to Earth without warning, more than likely the bird that should chirp the loudest will be sprawled out in the bottom of the mine shaft. Not only can it happen in the blink of an eye, that blink is now considered an eternity in today’s stock market.”
People lined up in droves as to express how “I just didn’t get social” and a whole lot more. I was also impugned by nearly every social media “expert” as to why views from people like myself should not only be ignored – but laughed at. Many pointed at the near immediate surge in valuation as the stock ticked higher, and higher in the following months. Yet, that’s not the story today.
The reality is that today – if you invested $1 dollar in their stock – ever. You are just about $1 away from losing money if you bought into at any time – ever. That’s because Twitter’s stock is dangerously close to falling beneath the lowest price paid/sold since it IPO’d. Again – ever! And if you were one of those whom just a mere 18 months cavalierly shouting “hashtag this!” as the stock price went higher and higher. How’s all that working for you today is all I’ll ask.
Or maybe you’re one that couldn’t wait to sink your
401Kteeth into LinkedIn™. Once again, after years of pushing higher, and higher, it seems the new story is same as the “old story.” i.e., They seemingly needed to spend money as to gain potential “integration opportunities” by buying something (e.g. $1.5 BILLION for Lynda™) rather than investing directly and maximizing everything of what LinkedIn currently is involved in. i.e., A glorified resume writing and/or job seeker data base.In other words: They can’t make money via the old model as to warrant their current valuations. So, instead of doing what they do, and doing it better, enabling higher net profits, it seemed they had better buy something that can. Even if the price paid (again a reported $1.5 Billion) is money spent not from net profits – but from Wall Street’s pocket. Because for all intents and purposes, where else did it come from when using GAAP they actually lost $68 Million last quarter?
All I can say, it appears someone made money. It just wasn’t LinkedIn, nor Wall Street, as they pounded its share price in one fell swoop some 10%. And so far, no one seems to be rushing in to buy at its now 25% plus or minus reduced “wonderful sale price” from where it stood only months ago.
How about Yelp™? Or should I say ouch? Because as of today that’s what many whom “invested” in this once heralded “social reviewing hot bed” are currently dealing with. And to spare many from yelping or howling more like dogs than what these stocks of late have morphed into. I won’t reiterate just how “clueless” I was scorned to be when I railed about other previous “darling” valuations and business metrics such as Groupon™.
This is the current, as well as ever-increasing pain of social reality coming to the entire social media space in my view. And I say “increasing” because I truly feel (and can argue the case) without QE – it’s over for this space as it currently stands today.
What portends for the space is how large some of these entities remain going forward, or, actually remain. That’s all up for debate. What’s not debatable or tolerable are the previous objections as to seek clarity to reasoned questioning about the business models, and/or viability going forward.
For the all too prevailing retort, laced with indignation, of the now well honed “well you don’t get it because – it’s different this time” will no longer suffice because – it’s different this time.

- Dramatic Footage: How Venezuelans Get Milk Powder
It’s been a sad week for Venezuela.
First, on Wednesday we showed what happens to local supermarkets when formerly Latin American paradises run out of other people’s money.
Then, the next day we showed what happens when in the aftermath of scenes such as the one above the social mood turns violent, and how what was once supposed to be a socialist utopia paradise ends uplooking like a warzone.
Today we show how the local population is forced to act like stampeding animals when it comes to obtaining even the most basic of staples, in this case milk powder.
The clip below speaks for itself.

- The Fed's Circular Logic Exposed In 1 Simple Chart
Submitted by Jeffrey Snider via Alhambra Investment Partners,
I typically stay away from sentiment indicators and measures of “confidence” not just because they are of dubious construction but they often don’t mean what they are taken for. In the case of consumer confidence, you get both problems simultaneously particularly at the ends of each cycle. In other words, just as “confidence” is at its greatest point and economists, especially the FOMC, assert that as evidence for further economic gains the rug is pulled out, “unexpectedly”, and a precipitous decline just shows up.
A few months ago I looked at the more recent break between confidence and spending. In past cycles, consumer confidence at least bore some coincident and even forward resemblance to economic activity, retail sales in particular. That broke down around 2011 as consumer “confidence” and spending have been unrelated ever since.

The reason the FOMC relies so heavily on confidence measures and surveys is rational expectations. The theory asserts feelings and psychology as more important than real factors, therefore it is assumed that influencing emotions is as much economically useful as even the helicopter option. The same is true of orthodox belief in the opposite, recession, as monetary policy attempts to banish “undue” pessimism as an answer to contraction.
With that in mind, the past year has offered what I think is a stunning rebuke to that theory. Starting in the spring of 2014, just after the nefarious cold winter, almost all the major indications jumped. The increases were questionable, and remain so, meaning that offers a useful control as far as attempting to measure the effects of pure numbers alone. Accounts like the unemployment rate, Establishment Survey and GDP surged without a matching increase in more “hard” data less subject to trend-cycle and non-seasonal seasonal adjustments. The response was striking in that the pure, number increases seemed to have worked upon at least consumer confidence (and, I would add, business confidence in the various business sentiment surveys).
A year ago, the surge began which is also a compelling contrast since the “dollar” and global finance started at the same time to retreat. That didn’t matter, of course, as all that seems to have penetrated was the constant drumbeat of the “economy is awesome.”
From July 2014:
Its [Conference Board] Consumer Confidence Index reached 90.9 in July, up from 86.4 in June. It was the third straight monthly increase and the best reading since October 2007. Tuesday’s report solidly beat economists’ median forecast for a reading in the mid-80s.
The report follows a five-month string of bright employment reports after a rocky start to the year that’s been mostly blamed on an economically-crippling hard winter. From February through June, the economy has added more than 1.2 million jobs and the unemployment rate has fallen to 6.1% from 6.7%.
“Strong job growth helped boost consumers’ assessment of current conditions, while brighter short-term outlooks for the economy and jobs, and to a lesser extent personal income, drove the gain in expectations,” said Lynn Franco, the board’s director of economic indicators. “Recent improvements in consumer confidence, in particular expectations, suggest the recent strengthening in growth is likely to continue into the second half of this year.”
That seemed to be the case as GDP grew nearly 4% in Q2 (since revised up) and then nearly 5% in Q3; with that “convincing” Q3 release published in December 2015. It wasn’t just the Conference Board’s estimates that surged, as everything from the University of Michigan Index to various Gallup economic tracking polls picked up the same robust “happiness.”


It is difficult in these various accounts not to notice the sudden and lasting downward bend now to July 2015. There is a hard reality that has shown up this year in sharp contrast to all those supposedly interpretive numbers from later last year. As an experiment in the two parts of rational expectations, it does appear as if the first part works. It wasn’t just the quickly falling unemployment rate that was intended to be convincing of the recovery arrival, however tardy by years. Alongside that was persistent reinforcement of the narrative by policy “noise” that was undoubtedly meant to foster those perceptions; by tapering QE, then ending it and further asserting an “exit” from even ZIRP, the FOMC was inarguably trying to harden those happy acuities into a coalesced economic reality.
That part appears to be validated, again, by at least consumer confidence if not also business confidence and even some measures of business activity (especially inventory). The second part, the more important transition, however, has been shown quite lacking. For all the immense referral to confidence and emotion, the ubiquitous TV economists talking up that 5% GDP and “best jobs market in decades” at every opportunity, it appears to have mattered so very little. In fact, as noted in May, spending very much departed at the very same time as confidence was surging.
The retrenchment in consumer spending started during the fall but really turned downward during the Christmas holiday period; right when confidence was at its inspired apex. It has only gotten worse since that point, with actual, nominal retail sales nearly contracting (and actually doing so ex autos). Retail sales in 2015 are worse now than they were during the whole of the dot-com recession. Regardless of how you interpret that in the context of the business cycle, it is at least a disqualifying contrast to what rational expectations asserts of emotion – happy and optimistic consumers did not lead to actual spending renaissance but rather yielded to its opposite.
I think that rightly accounts for the round trip so far in the middle of 2015, as economic reality is more of a confirmed now slump that actually bodes much worse for the rest of the year. When consumer confidence was at its peak in January, the idea of a protracted decline or even recession seemed, in the orthodox-contained mainstream, laughable. Yet here it is, now entering the second half long past the “residual seasonality” and weather-drawn obfuscations (port strike still?).
Even the unquestioned payroll expansion has fallen to such degeneracy. The Conference Board shocked yesterday with its July 2015 decline, as the “expectations” portion of the index just collapsed from 92.8 in June to just 79.9. The reason, questionable labor markets:
“A less optimistic outlook for the labor market, and perhaps the uncertainty and volatility in financial markets prompted by the situation in Greece and China, appears to have shaken consumers’ confidence,” Lynn Franco, director of economic indicators at the Conference Board, said in a statement.
'Americans’ assessments of current and future labor-market conditions deteriorated. The share of those who said jobs were plentiful dropped to 20.7 percent in July from 21.3 percent.
The proportion of consumers expecting more jobs to become available in the next six months decreased to 13.1 percent, the lowest since November 2013, from 17.1 percent in June. [emphasis added]
This is something that is unsurprising given 2015 in its more general sense so far. Even the vaunted Establishment Survey, still running at a high rate, has cooled somewhat. If you factor in trend-cycle, this disparity between feelings and activity becomes less surprising. In my view, especially in tandem with the break between confidence and spending, these are results of the “fake” recovery in total.
In short, policy constructs the visible façade of recovery in the expectation that businesses and consumers will then fill it out beyond, a mechanical response to only noticeable changes. In that way, the fiscal view and the monetary view are supposed to be highly complimentary, as the government redistribution creates spending transactions financed by the monetary, central bank redistribution through asset prices and debt (modern “money”).
Recovery is actually none of that, as what drives actual spending apart from forced redistribution is always opportunity; and that is not something that can be faked or reduced into mechanical, spreadsheet formality.
I think that last part is being proven by “confidence” , as everything was supposedly going right last year, the appearance at least of the recovery arrival was as strong as perhaps it was ever going to be. In the end, again, it amounted to very little, likely even less than nothing as there is attrition to consider that these primarily monetary experiments are not neutral. There is really nothing left of last year’s “inarguable” sentiments except renewed questions of veracity all the way down to even the most basic constructions. GDP may be revised up for Q1 and Q2 may actually be 2% or more, but neither is even close to what was promised and derived from 2014’s unbridled rational expectations “experiment.”

Hope, quite simply, just isn’t close to enough for a real recovery. Spending grew only worse during this “sample” period, and the fact that consumer confidence round tripped to that point shows that perfectly well. Confidence is still important to the economic system, but unlike orthodox expectations it is only a part and maybe even a small part. More than sentiment, there has to be actual jobs and wages, which I think the cycling trajectory of confidence is but another marker that those supposed job gains last year were, in fact, figments of statistical imagination. In short, the presentation of estimated job gains created broad hope in Americans not that jobs had already arrived but rather in how they thought that might signal jobs that would come. I think that is why the labor force never expanded as it should have, signaling more strongly that this was all just imaginary.
There is an undeniable element of troubling prevarication in the whole attempt to coax unearned optimism, as taken to the extreme it means that policymakers will never quite be honest about especially realistic downsides. That may even mean, in their zeal to “fool” consumers, they fool themselves on the circular logic.


- US Police Kill 118 People In July, Highest Monthly Total Of 2015
Early last month in “Crowdsourcing Police Brutality“, we highlighted an ongoing project at The Guardian which is attempting to tally the number of people killed by police in the US during 2015. Use of deadly force by authorities in America has become a hot button issue after several high profile cases involving the death of unarmed black suspects culminated in a night of violent protests in Baltimore.
In the wake of Baltimore’s “purge” (as April’s protests came to be known), two competing theories emerged about what effect the controversy has had on policing in America. We’ve outlined the two theories on a number of occasions, but for those unfamiliar, here’s a recap:
One theory — dubbed the “Ferguson Effect” — claims police are now reluctant to engage in “discretionary enforcement” for fear of prosecution. “Discretionary enforcement” of course refers to the use of lethal force in the line of duty and the implication seems to be that in light of recent events, law enforcement officers are afraid that their actions will be scrutinized by the public. In extreme cases, such scrutiny could culminate in social unrest, something no one individual wishes to be blamed for.
Casting doubt on the so-called Ferguson Effect is a report from The Washington Post which shows that US police are shooting and killing “suspects” at twice the rate seen in the past. More specifically, 385 people have been killed by police in 2015 alone. Unsurprisingly, minority groups are overrepresented in cases involving the fatal shooting of unarmed suspects.
Despite a notable spike in violence across Baltimore in the months since the riots and the persistence of violent crime in Chicago, the number of people killed by police across the country posted M/M declines in April, May, and June. In July, the trend was broken. Here’s The Guardian with more:
July was the deadliest month of 2015 so far for killings by police after registering 118 fatalities, according to the Guardian’s ongoing investigation The Counted, which now projects that US law enforcement is on course to kill more than 1,150 people this year.
The July figure brought an end to a steady decline in totals over the previous four months. After 113 people were killed in March, 101 died in April, 87 fatalities were recorded in May and 78 in June.
At least 20 people killed in July – more than one in six – were unarmed, including Samuel DuBose, who was shot by University of Cincinnati officer Ray Tensing in a 19 July traffic stop that has become the latest flashpoint in protests over the police’s use of deadly force.
Of the 118 people, 106 died from gunfire, making July also the first month of 2015 in which that number has exceeded 100. Two people died after officers shocked them with Tasers, two died being struck by police vehicles, and eight died after altercations in police custody.
Tensing had claimed DuBose dragged him with his car, but footage recorded by Tensing’s body camera refuted his account. The officer was charged with murder on Wednesday, when at a press conference the Cincinnati prosecutor Joe Deters called the shooting “senseless” and said Tensing “should never have been a police officer”.
Tensing, who turned himself in on Wednesday, was arraigned on Thursday and has been released on bail. On Friday it was announced by Deters’s office that two officers who appeared to reinforce Tensing’s false account will not be charged with any crimes.
For those who haven’t seen the body cam footage referenced above, here is the incident:
As a reminder, The Guardian’s effort stems from what it says is a generalized failure on the part of the US government to keep a “comprehensive record of the number of people killed by law enforcement” which it says is a “prerequisite for an informed public discussion about the use of force by police.”

Again, we’ll leave it to readers to determine what it says about police accountability in America when other countries feel compelled to put a face and a name to hundreds of people whose deaths, if left in the hands of the US government, might have gone unnoticed or worse, undocumented.

- The 2016 "Dream" Ticket
Who needs bread and circuses…

Source: Townhall.com

- Here's The Bad News That Nobody Is Telling You About The Record Lows In Initial Jobless Claims
Submitted by Lee Adler via WallStreetExaminer.com,
The headline, fictional, seasonally adjusted (SA) number of initial unemployment claims for last week came in at 267,000. The Wall Street economist crowd consensus guess close to the mark this week, at 272,000.
We focus on the trend of the actual data, instead of the seasonally manipulated headline number expectations game. Facts tend to be more useful than the economic establishment’s favored fictitious numbers. Actual claims based on state by state filings were 230,430, which is another record low for this calendar week. It continues a nearly uninterrupted string of record lows that began in September 2013.
The Department of Labor (DoL) reports the unmanipulated numbers that state unemployment offices actually count and report each week. This week it said, “The advance number of actual initial claims under state programs, unadjusted, totaled 230,430 in the week ending July 25, a decrease of 32,519 (or -12.4 percent) from the previous week. The seasonal factors had expected a decrease of 43,528 (or -16.6 percent) from the previous week. There were 257,625 initial claims in the comparable week in 2014. ”

Initial Claims and Annual Rate of Change- Click to enlarge
You can see for yourself from the chart just how extraordinarily low these numbers are.
When using actual data we want to see if there’s any evidence of trend change. Thus we look at how the current week compares with this week in prior years, and whether there’s any sign of change. The actual change for the current week was a decrease of -32,500 (rounded). This week of July always has a large drop. Based on the data for this week from the last 10 years, the current decline was not very good, stronger than only last year (-29,500), and the same week in 2008 (also -29,500). In 2008 the economy was collapsing. The 10 year average decline for this week was -70,000.
Is this weakness material? Week to week changes are noisy. The trend is what is important and it remains on track. Actual claims were 10.6% lower than the same week a year ago. Since 2010 the annual change rate has mostly fluctuated between -5% and -15%. This week’s data was right in the middle of that range. There’s no sign yet of a significant uptick in the trend of firings and layoffs.
Population has been growing and the size of the workforce has as well, although not as fast as population. To get a better idea of how the claims data is performing over time, I normalize it based on the size of monthly nonfarm payrolls. Here’s where we can see just how extraordinary the current levels are. There were 1,613 claims per million of nonfarm payroll employees in the current week. This was a record low for that week of July, well below the 2007 previous record of 1,889. The 2007 extreme occurred just before the carnage of mass layoffs that was to begin a couple of months later. Employers were still clueless that the end of the housing bubble would have devastating effects. If they were clueless then, they are in an advanced state of delirium and delusion now.
However, it is absolutely normal for employers to completely miss the signs of impending doom.
Last week the media noted the fact that claims were lower than the record low of 1973. What they failed to mention was that that low came well after the Dow reached an all time high in January of that year. The devastating 1973-74 bear market, which cut the value of stocks by 50%, was in its early stages. This was an early example of employers being late to the funeral.

Employers Late To The 1973 Funeral
Click here to view chart if viewing in email
Similar employer hoarding of workers has been associated with bubbles in the more recent past and has led to massive retrenchment, usually within 18 months or so. In the housing bubble, employer hoarding behavior continued well beyond the peak of that bubble in 2005-06.
It’s worth noting that there was an institutional stock market bubble in 1972-73. It was the Nifty Fifty bubble, where the biggest best known stocks kept soaring while everything else in the market went nowhere. A bubble does not require mass public participation. Institutional bubbles are just as insidious, even more so.
The current string of record lows in claims is now 5 months beyond the point at which other major bubbles have begun to deflate. Based on the fact that previous records were attained at and for some time after the peaks of massive bubbles, by that standard, the current financial engineering, central bank bubble finance bubble, which is very much a big money, institutional bubble, may be the bubble to end all bubbles!
As a result of the fact that employers apparently tend to take their cues from stock prices, we cannot depend on the next downturn in the claims data to give us advance warning of a decline in stock prices, although there should at least be concurrent confirmation. However, history shows that the fact that claims are at record lows is warning enough!

Initial Claims and Annual Rate of Change- Click to enlarge
I look at an analysis of individual state claims as a kind of advance decline line for confirmation of the trend in the total numbers. The impact of the oil price collapse started to show up in state claims data in the November-January period. While most states show the level of initial claims well below the levels of a year ago, in the oil producing states of Texas, North Dakota, Louisiana, and Oklahoma, since the beginning of 2015 claims have been consistently above year ago levels. North Dakota and Louisiana claims first increased above the year ago level in November of last year. Texas reversed in late January. Oklahoma joined the wake shortly after that.
Data for the July 25 week:

Claims increased year to year in North Dakota, Oklahoma, and Texas. The drop in Louisiana this week is suspicious. It may be a reporting issue. That state has consistently shown higher year to year claims. The numbers have varied widely week to week but the trend of claims being significantly higher than the same week last year has been persistent. Texas, with a huge and more diversified economy improved in the second quarter as the price of oil rebounded and stabilized, but that improvement was temporary and new claims in Texas have been climbing in July.
In the July 25 week, in total only 7 states had more claims than in the same week in 2014. That was down from 11, last week. This number fluctuates widely week to week with many states near even. At the end of the third quarter of 2014 just 5 states showed an increase in claims year to year. At the end of 2014 that had increased to 8. In early April this year the number had risen to 22. The number this week is the lowest it has been all year. This is yet another example of the extreme which employer hoarding of workers has reached.
The 22 states that were higher in early April gives us a benchmark to watch, similar to an advance decline line in the stock market. If the number of states showing a year to year increase in claims should exceed 22, it should be an indication that the national trend of decreasing claims has reversed.
I track the daily real time Federal Withholding Tax data in the Wall Street Examiner Pro- Federal Cash Flows report. The year to year growth rate in withholding taxes in real time is now running +3.5% in nominal terms. That’s equivalent to around +1.5% to 2% adjusted for wage inflation. The growth rate has dropped sharply in July after being remarkably consistent around +5-6% in the second quarter.
Withholding tax collections tend to rise and fall in a cycle lasting three to four months. It’s too soon to tell if the July drop is the beginning of weakening in the slow growing top line of the “Tale of Two Economies,” US economy, or just part of the normal cyclical swing pattern in this data. The behavior of the data over the next several weeks will tell.
The following is reposted from prior reports for the benefit of new visitors.
The July 12 week was the reference week for the July payrolls survey. The numbers for that week were weaker than the June numbers, suggesting that Wall Street economists are likely to find their estimates for July are too high. Whether the cockamamie seasonally adjusted headline number reflects that reality or not is a crapshoot. It takes the BLS 7 revisions of the SA data over 5 years to fit it to the actual trend. The first release is hit or miss. But even if the number comes in below expectations, it probably will not influence the Fed, which remains hellbent on trying to get rates up sooner rather than later.
The Fed’s favored measure of inflation, PCE, suppresses the measurement of inflation even more than the just released CPI. If the Fed believed this data, it would be even further behind the curve in recognizing that inflation is running much hotter than the official measures show than it is. The Fed knows that, and has inserted weasel words into its various propaganda releases that it will raise rates as long as the Fed thinks that inflation is moving toward the 2% target. It does not actually need to be at the target. The Fed is prepared to ignore the official measures because the members realize that they’re bogus.
The Fed will use or ignore whatever stats it wants depending on whether they fit its preconceived narrative, which is “We’re gonna try to raise rates at least once this year, and if that doesn’t work, we’ll think of an excuse not to do it again, because raising rates is really data dependant depending on which data dependably supports our narrative, and which data we will ignore, because it all depends on dependably dependant official data, none of which is dependable.”
The actual claims data, and actual withholding data, show the financial engineering bubble economy is still at full boil. This will continue to encourage the Fed to engage in the charade of pretending to raise interest rates sooner rather than later, but only because they have conditioned the market to expect it, a conditioning that they now regret they had undertaken. They’re walking back expectations now because they know they will have problems getting rates to go up.

- Russian Military Helicopter Crashes During Air Show Celebrating Airborne Forces Day, One Pilot Dead
August 2 is the day when Russia celebrates its Airborne Forces, only this year something went very wrong, and it was all caught on tape.
As Reuters report, one pilot died and another was injured when a helicopter crashed at an airshow in the Russian region of Ryazan on Sunday. During aerobatics at the event some 200 km (124 miles) south-east of Moscow, an Mi-28 helicopter went into a flat spin before crashing.
RT adds that while performing a stunt at the Aviamix air show on Sunday, a helicopter belonging to the Berkuty (Golden Eagles) aerobatic team suddenly banked on one side and started to lose height.
The moment the helicopter lost control and crashed was caught on video:
Russia’s Air Force Commander-in-Chief Viktor Bondarev has ordered the grounding of all Mi-28 assault helicopters following the catastrophe in central Russia, the Defense Minister reported.
“The crew fought to save the helicopter to the end. Unfortunately, the chief pilot died on impact – the co-pilot survived. According to the second pilot, the accident occurred due to technical failure. I have suspended all Mi-28 flights. The commission under my leadership is working to clarify the causes of the disaster,” Bondarev said.
As of this moment, there has been no hint of industrial sabotage either through Stuxnet or Windows 10.

- As China Admits It Lied About Its Local Debt Levels, Local Billionaires Are Quietly Liquidating Their Assets
It was almost exactly two years ago, when during China’s long-forgotten attempt to actively deleverage its economy (remember that? good times…) we commented on the country’s s first attempt to estimate what its local government debt is since June 2011.
This is what we said in July 2013:
“China is preparing to admit that the level of problem Local Government Financing Vehicle debt is double what was first reported just two years ago, something many suspected but few dared to voice in the open. But not only that: since the likely level of Non-Performing Loans (i.e., bad debt) within the LGFV universe has long been suspected to be in 30% range, a doubling of the official figure will also mean a doubling of the bad debt notional up to a stunning and nosebleed-inducing $1 trillion, or roughly 15% of China’s goal-seeked GDP! We wish the local banks the best of luck as they scramble to find the hundreds of billions in capital to fill what is about to emerge as the biggest non-Lehman solvency hole in financial history (without the benefit of a Federal Reserve bailout that is).”
Not at all surprisingly, after conducting the goalseeked “exercise” of estimating its local government debt, the final number was well below the worst case or even average scenario, while the level of NPLs was at a very leisurely pace around 1% of total.
We promptly accused China of doing what it does best: fabricate the data, but since the housing bubble was still raging (it has since burst), and the stock market bubble (which also popped a month ago) was yet to be unveiled, few cared. Furthermore, in early 2015 China unveiled an LTRO-type plan in which in would swap out maturing local government debt with long maturities, thus hoping to firmly shove the problem with unsustainable local government debt under the rug for the (un)forseeable future.
Then overnight something unexpected happened: Sheng Songcheng, the director of the statistics division of the People’s Bank of China (PBOC), was quoted by the National Business Daily on Saturday whereby he essentially admitted China had been lying about not only its local debt exposure but the level of NPLs across the economy.
Quoted by Reuters, Sheng said that “downward pressure on China’s economy will persist in the second half of the year as growth in infrastructure spending and exports is unlikely to pick up.”
He said that Chinese companies are not optimistic about business prospects according to the central bank’s second-quarter survey, and that :pressured by uneven domestic and export demand, cooling investment and factory overcapacity, China’s economic growth is expected to slow to around 7 percent this year, the lowest in a quarter of a century, from 7.4 percent in 2014.” The Chinese GDP reality, of course, as noted here before is somehere in the 1-3% range, and based on such more credible metrics as industrial production and electricity usage, it may even be negative.
The punchline: Sheng warned about the risks of local government debt, saying that 2 trillion yuan ($322.08 billion) in bond swaps may not be able to fully cover maturing debt, according to the report.
What he really said, as paraphrased by Bloomberg, is that “local governments tended to not report all their debts when audited in June 2013, thus the 2 trillion yuan debt swap plan arranged this year may not cover all debts due, Sheng cited as saying.”
Oops.
In other words, because the local governments lied (and Beijing had no idea, none at all this was happening) China will have no choice but to engage in an even more active bailouts.
That’s not all: as a result of China’s various bubbles bursting, the biggest problem with the nearly $30 trillion financial system in the world’s most populous country is sttarting to be revealed: its non-performing loans, i.e, the level of bad debt. According to Sheng outstanding bad loans and NPL ratio at banks rose in 1H; banks’ profit growth slowed, Sheng cited as saying. NPL ratio reached 1.87% as of end-June, report cites Sheng as saying, without specifying which banks he refers to.
And if China is admitting a NPLs ratio of 1.87%, then the real print is probably 4-5x greater. Which means that on a system with $26 trillion in deposits, approximately $3 trillion in loans is non-performing. Or about half the market cap of Chinese stocks, and a third of Chinese GDP.
Is the problem starting to become clear? It is to some, particularly China’s wealthiest.
WSJ reports that having glimpsed what is coming over the horizon, China’s wealthiest are quietly starting to dumb their holdings to the greatest fools: “A property developer backed by Hong Kong billionaire Li Ka-shing has put an office and retail property project in Shanghai up for sale, according to two people familiar with the matter. A sale would mark the latest China property divestment by the investor, one of Asia’s richest, who is closely watched for signs of how he sees markets shifting.”
This is not the first time Ka-Shing has cashed out in recent months:
In June, Mr. Li’s Cheung Kong Property Holdings Ltd. put up for sale Century Link and Century Link Tower, a shopping mall and twin office towers currently under construction in the Pudong Lujiazui area, said people briefed on details of the offer. A Cheung Kong spokeswoman didn’t respond to requests on Sunday for comment.
Or just before the market crashed. And then more previously:
Over the past two years, companies backed by Mr. Li and his family have sold five office and shopping mall projects in Shanghai, Beijing, Nanjing and Guangzhou. Many investors eye moves by his companies for hints on the tycoon’s view of the property market.
His companies, including Hutchison Whampoa and ARA Asset Management Ltd., have been offloading their real-estate assets as China’s economy decelerates to its slowest growth in more than two decades.
It remains to be seen who will buy what Ka-Shing is selling: if indeed the public mood is determined by his marginal trading activity, only the government will be bold enough to acquire his assets now that he has entered a liquidation phase, especially since the asking price of just one commercial project is about $2.6 billion.
The asking price is around 60,000 yuan per square meter, the people said. According to Cheung Kong Property’s website, the shopping mall and office project occupies a total of about 269,000 square meters, which would bring the total asking price to more than 16 billion yuan ($2.6 billion).
To sum up: misrepresentations about local government debt, lies about bad debt levels, and now, the wealthiest locals are quietly, slowly getting out of Dodge, er, China. We can only hope that China’s desperate attempt to hold up its stock market, the final frontier before all confidence in China crumbles alongside, lasts a few months longer, or the great Chinese hard landing that has been discussed for years, and always delayed in the last moment, is now virttually inevitable.


Digest powered by RSS Digest
 Saving...
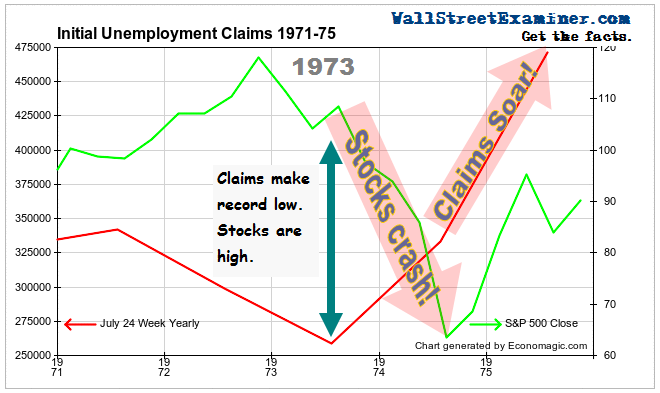